CSAT software

CSAT software that measures satisfaction at the moment of experience

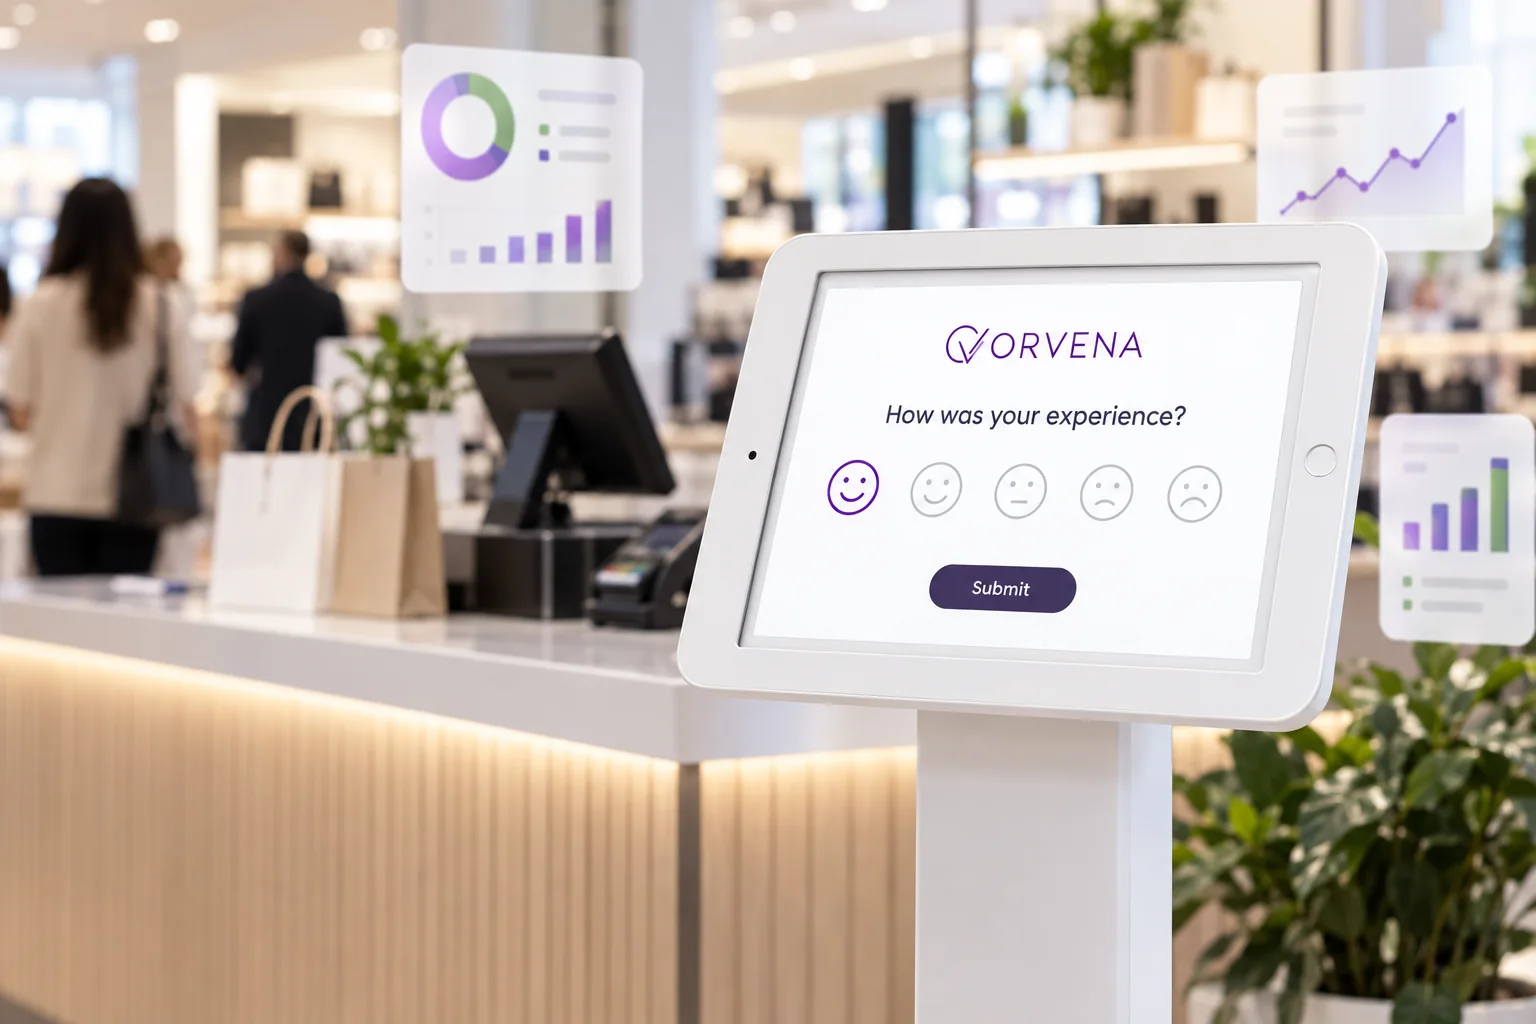
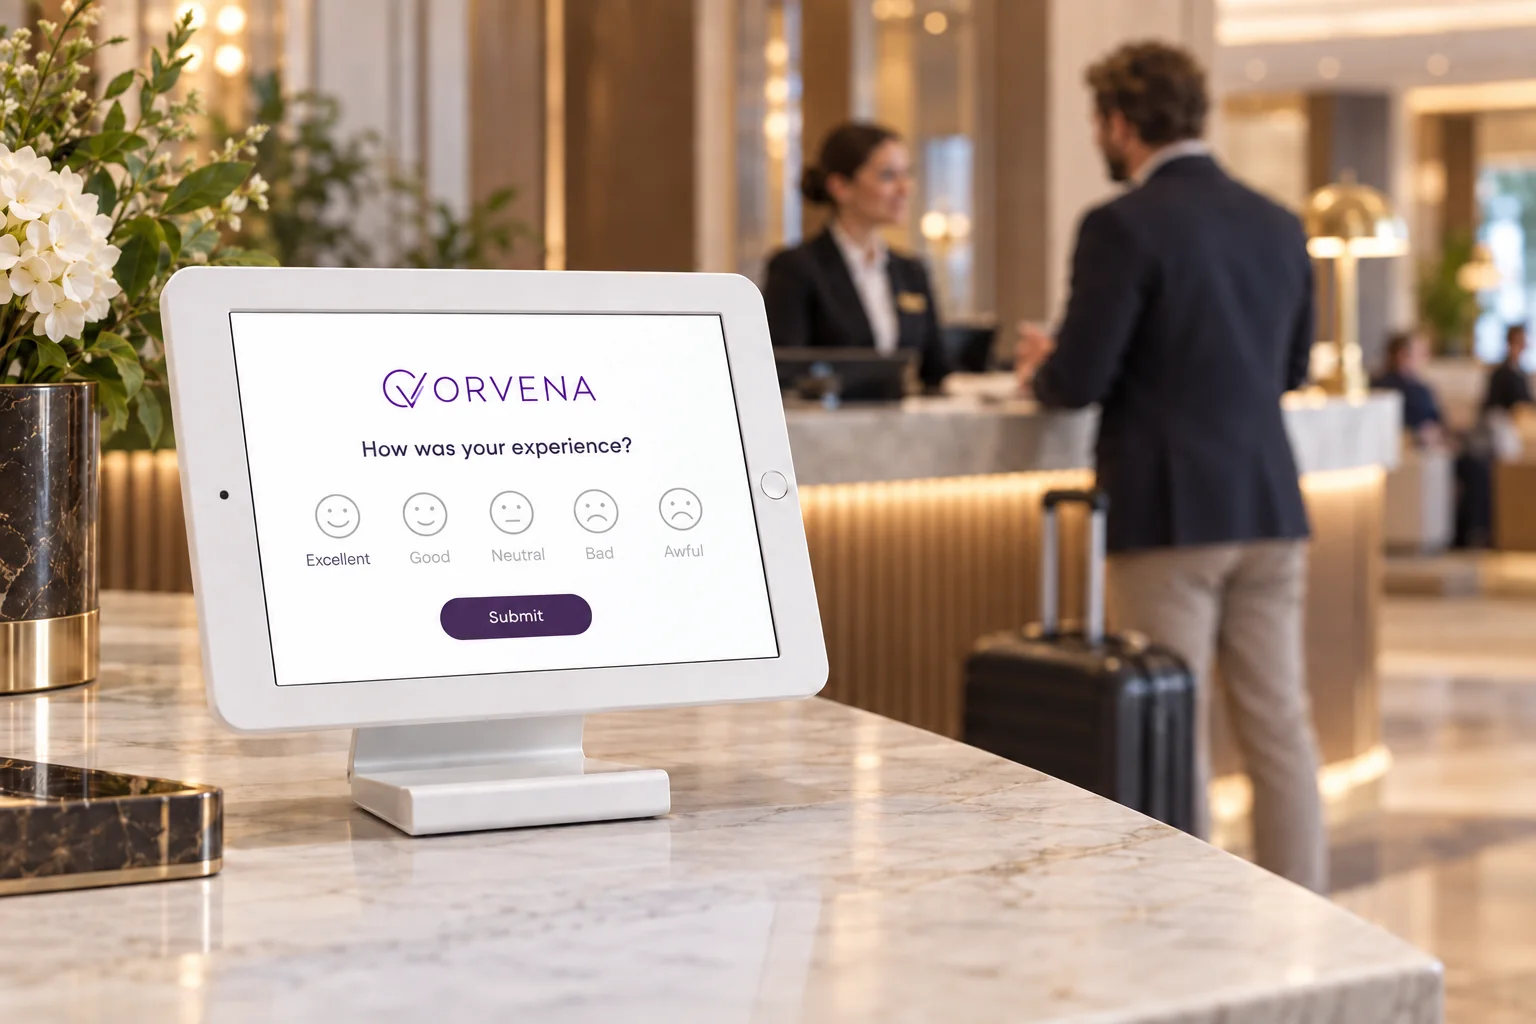
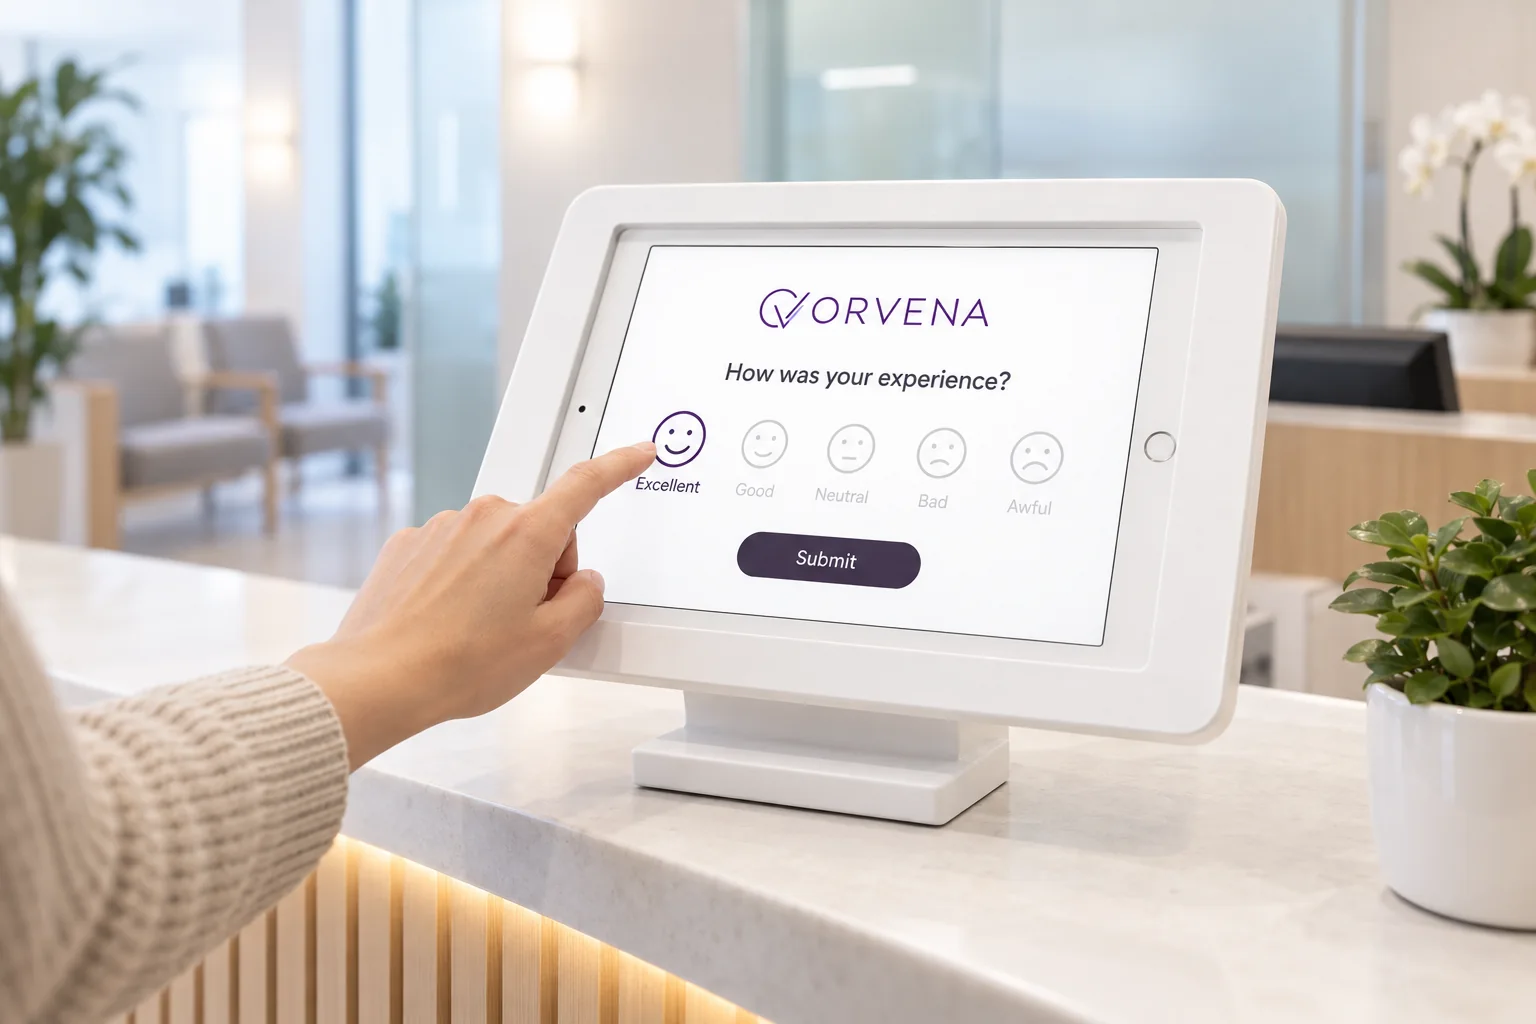
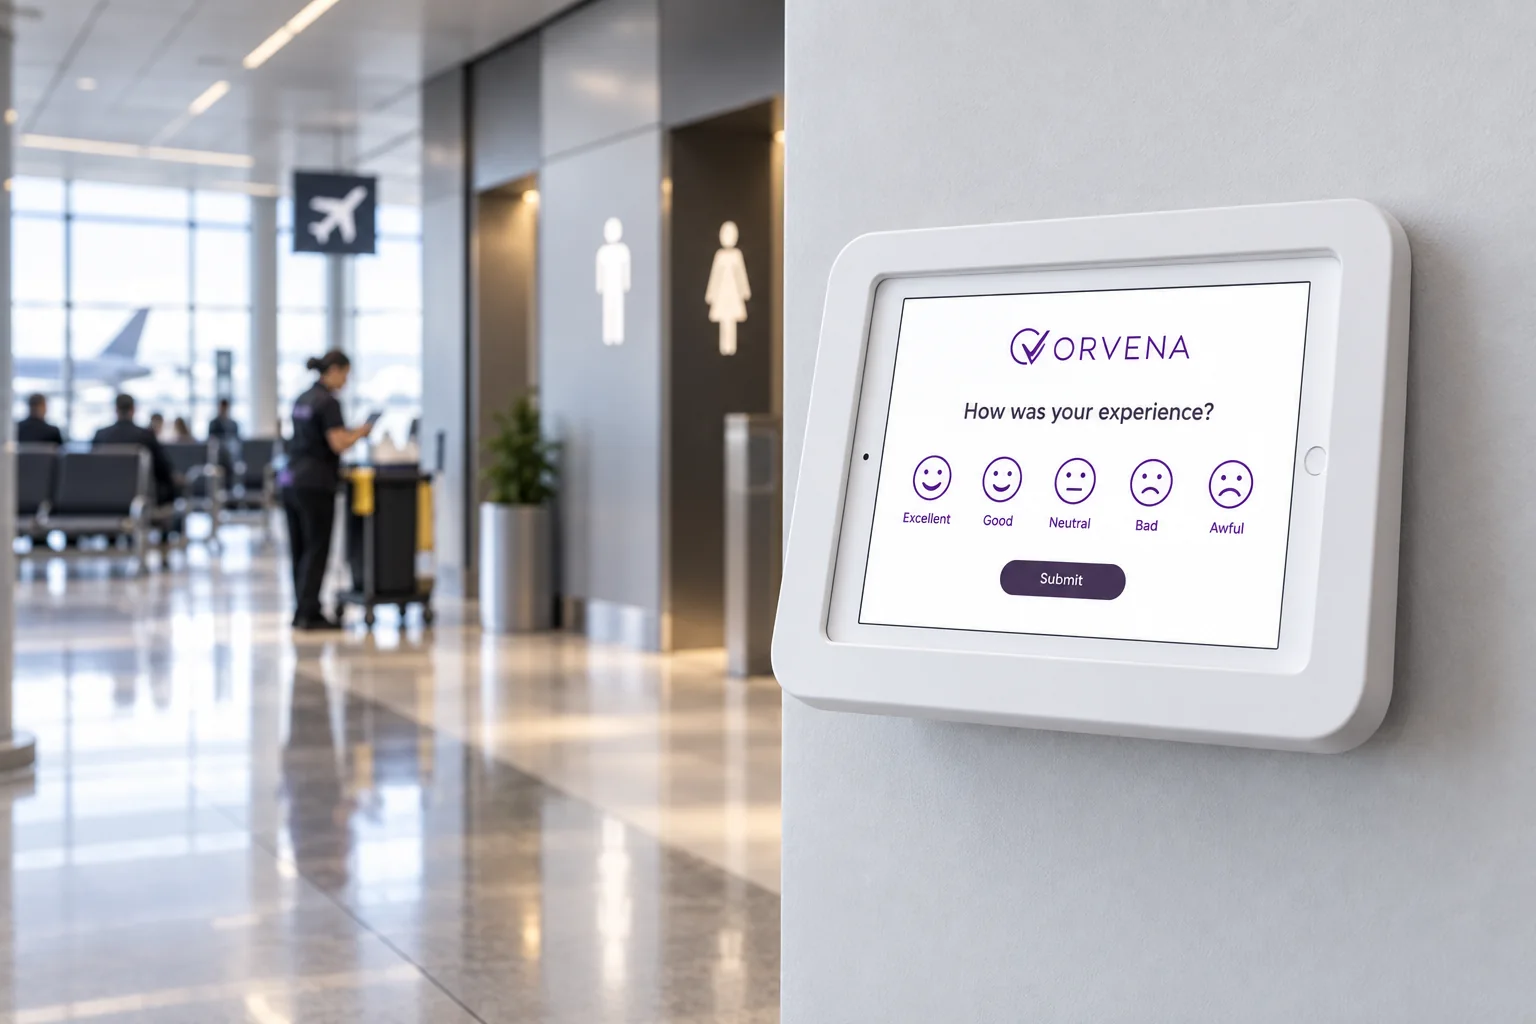
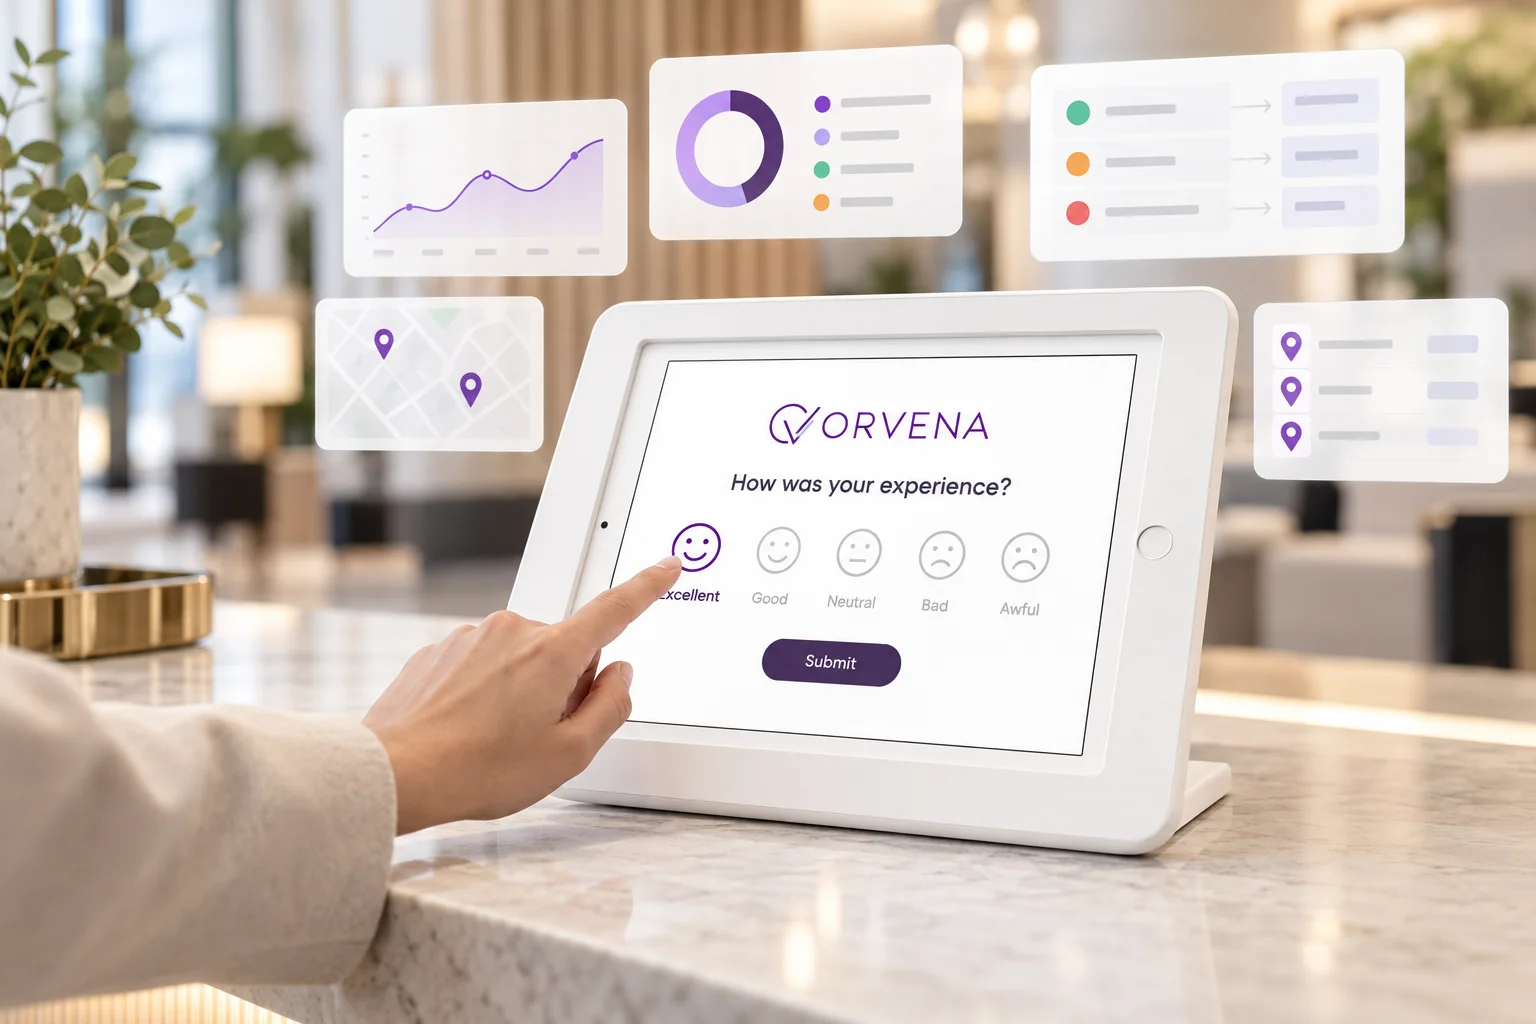
Qmeter is CSAT software that asks the satisfaction question right after the interaction, with a smiley on a kiosk, a QR code on the receipt or an SMS after the call, and reports the customer satisfaction score by branch, service and hour. Low scores open tickets automatically, so the score gets improved rather than just watched.

Five faces or five stars, per service and per location, on the same dashboard as NPS and SLI, and every low score with an owner and a deadline.

See pricing
1000+companies use Qmeter
2M+feedbacks collected
15+years in customer experience
Customer smiling while being helped at a service counter
Definition

What is CSAT software?

CSAT, the customer satisfaction score, is the share of customers who rate an interaction positively — on a five-point scale, the top two answers. CSAT software asks right after the service and reports the score by service, branch and hour.

  • Smileys or stars — a two-second tap.
  • Per service — the score points at what to fix.
  • Low scores open tickets automatically.

Differences and benchmarks: CSAT vs NPS vs CES.

Satisfaction measured with one smiley tap right after the service
How it works

From a smiley tap to a fixed service

Four steps, one platform. The screens below are the live product on a demo account.

01

Choose the scale and tie it to a service

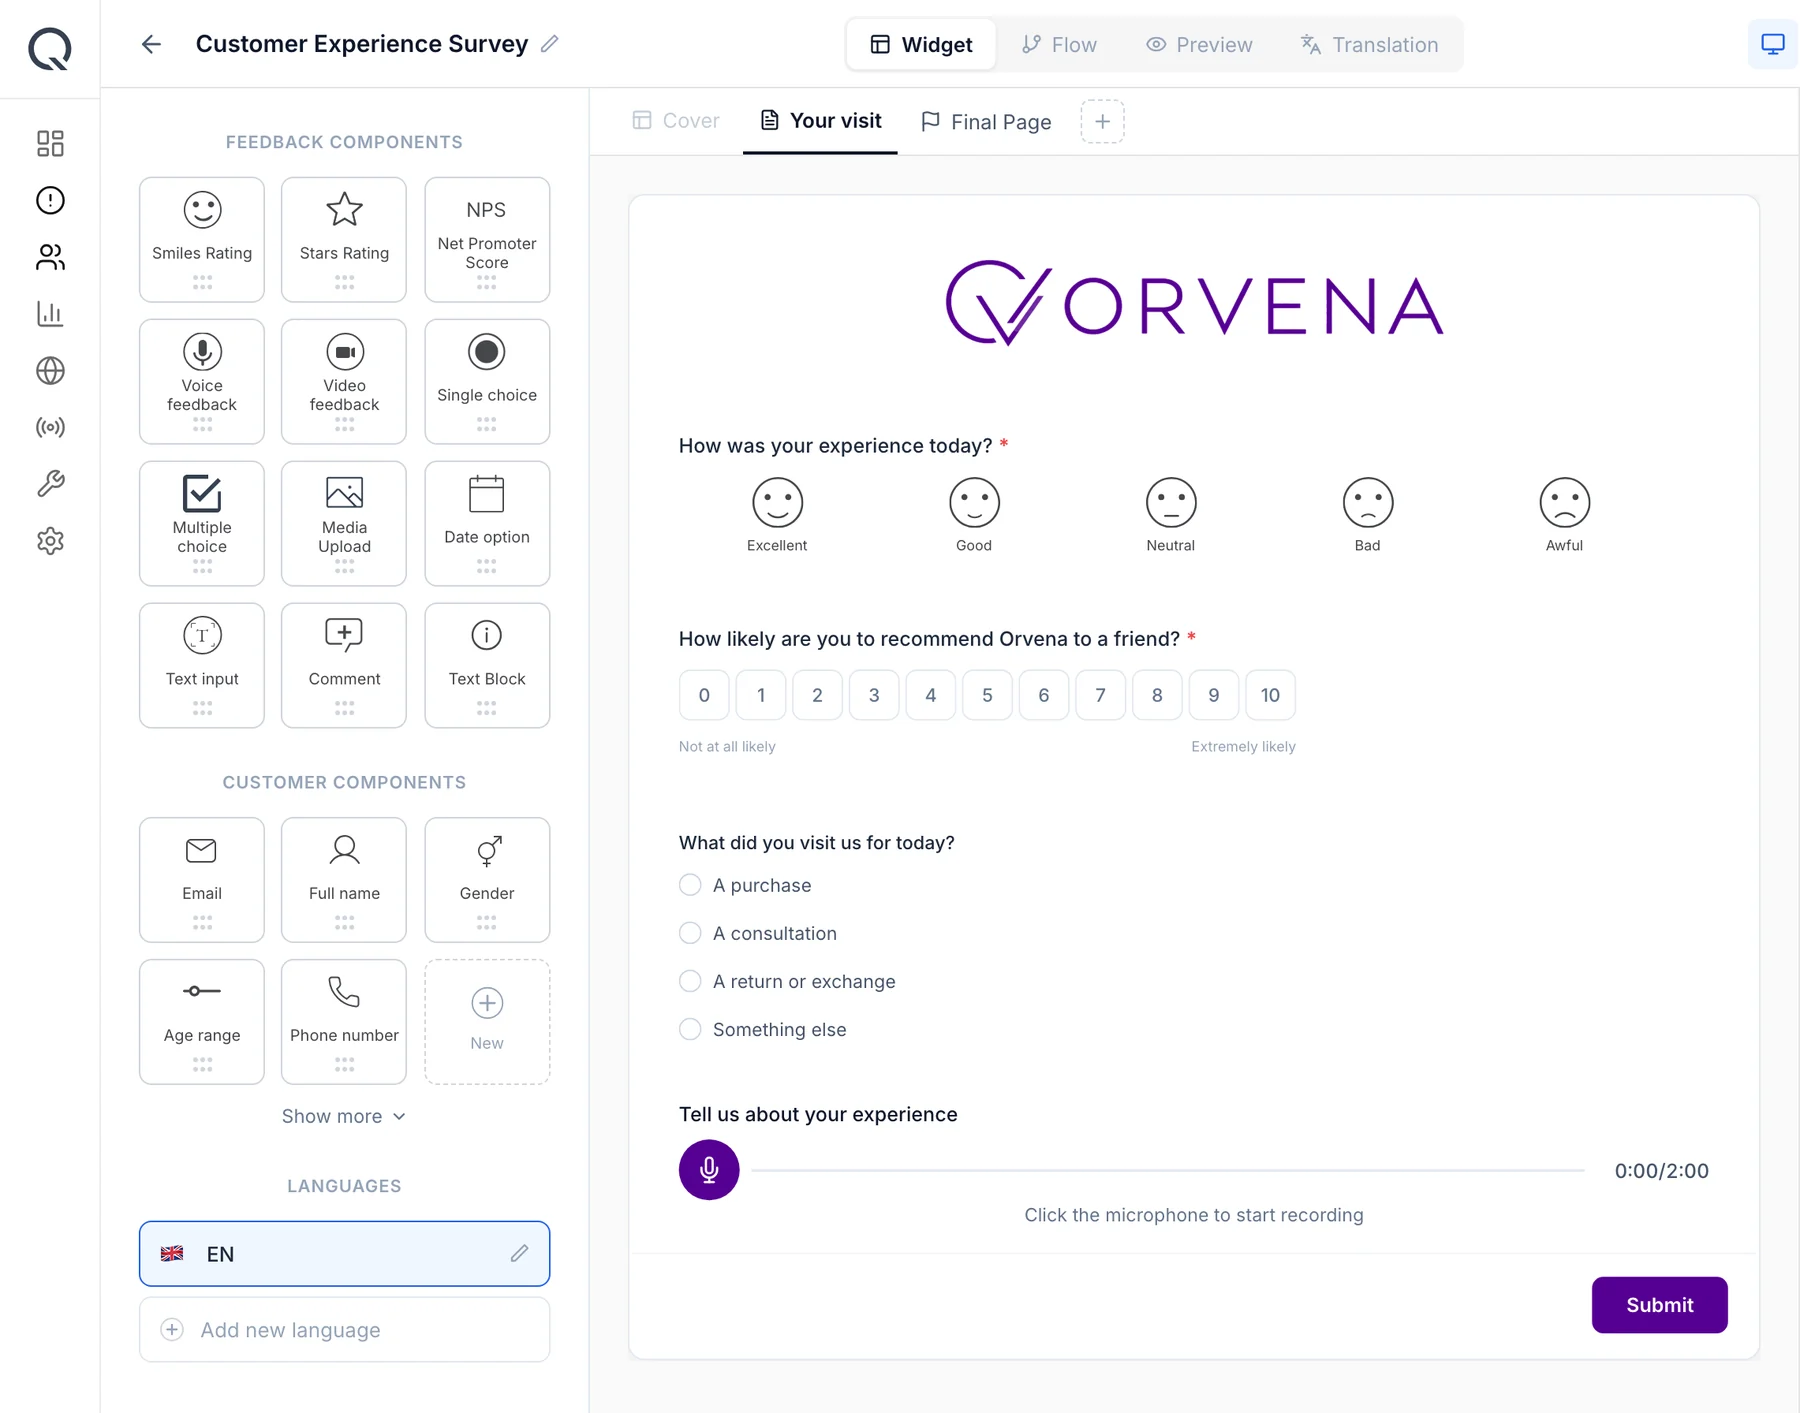
Choose five smileys or 3–10 stars and tie each question to a service — checkout speed, staff helpfulness, cleanliness. Add a follow-up that appears only after a low rating.

Qmeter survey builder: ORVENA logo, a smiley question, the NPS scale, a single-choice question and voice feedback
02

Ask at the moment of experience

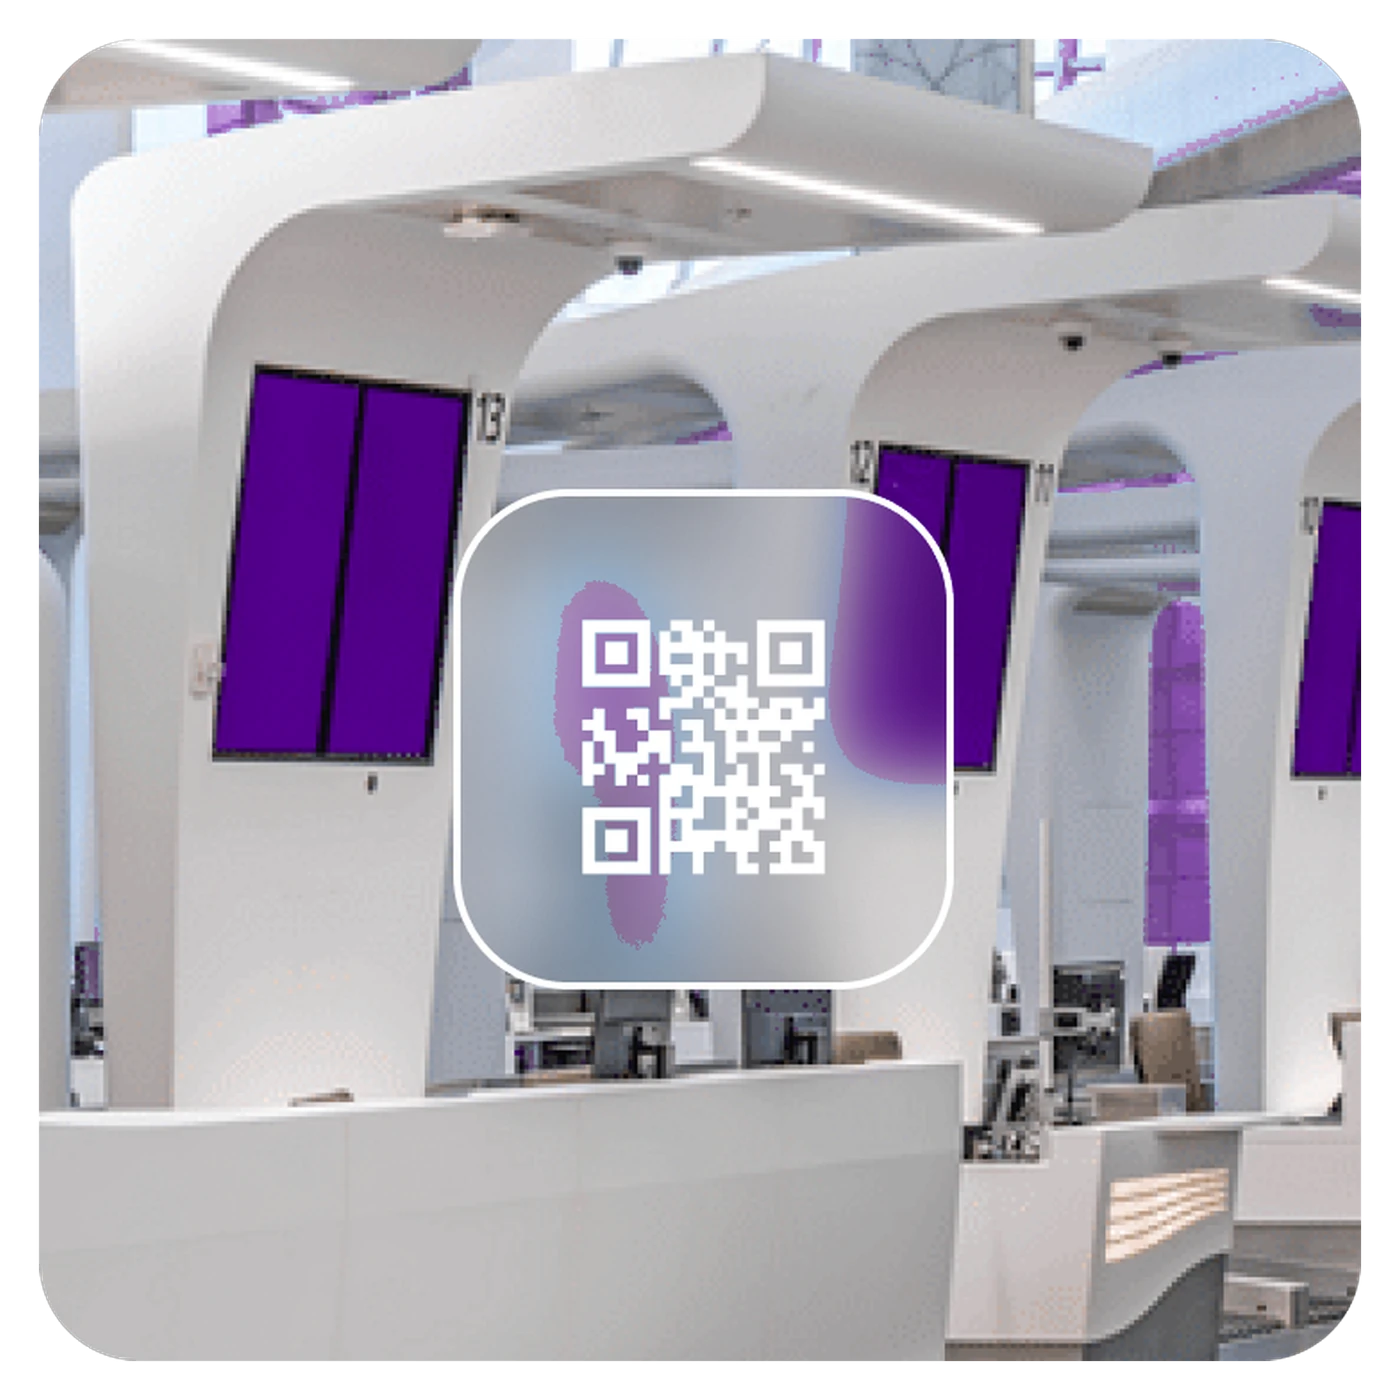
Ask right after the interaction: on a feedback kiosk at the exit, through a QR code on the receipt, or by SMS after a call. Every channel runs the same template, so scores stay comparable.

QR code feedback point inside a branch
03

See which service drags the score

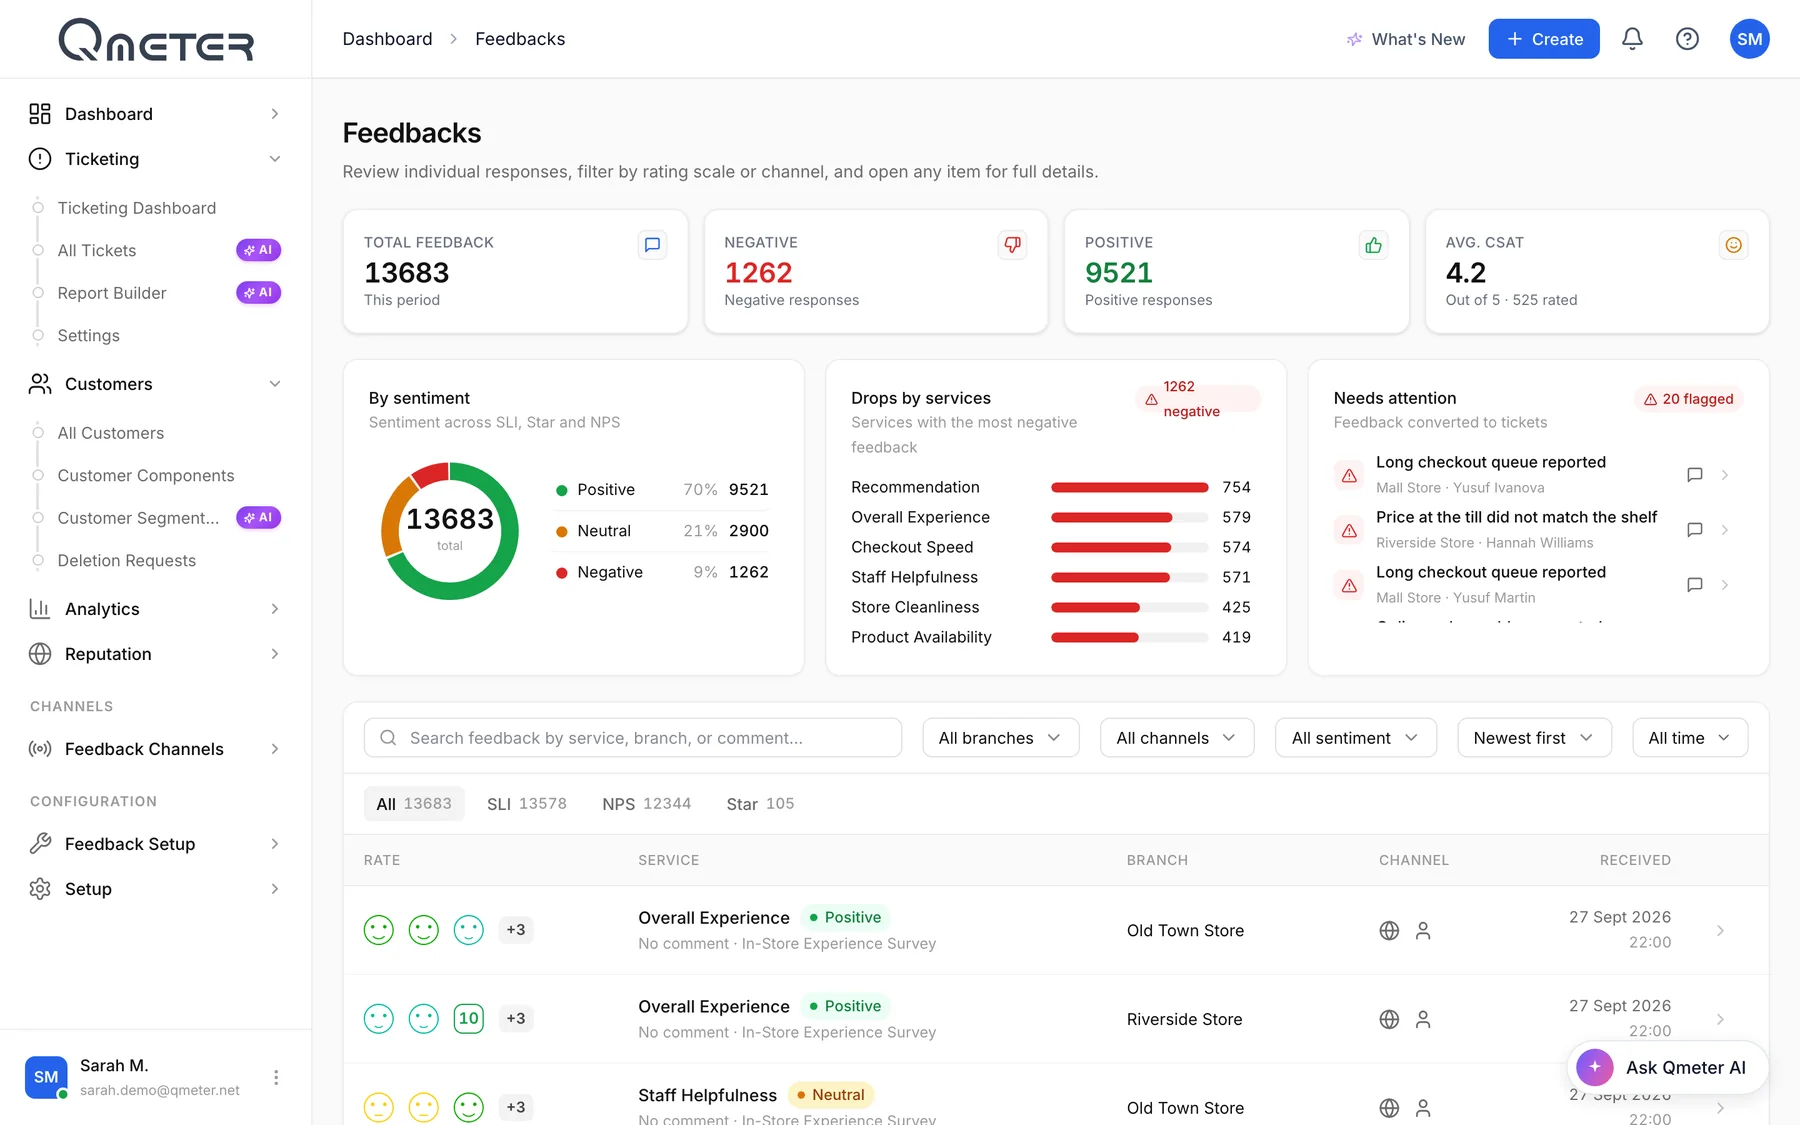
The feedback view shows sentiment, the services with the most negative ratings and the items already turned into tickets. Filter by branch, channel and date to find the service that drags the score down.

Qmeter feedback list with sentiment, drops by service and feedback converted to tickets
04

Fix the low score, then measure again

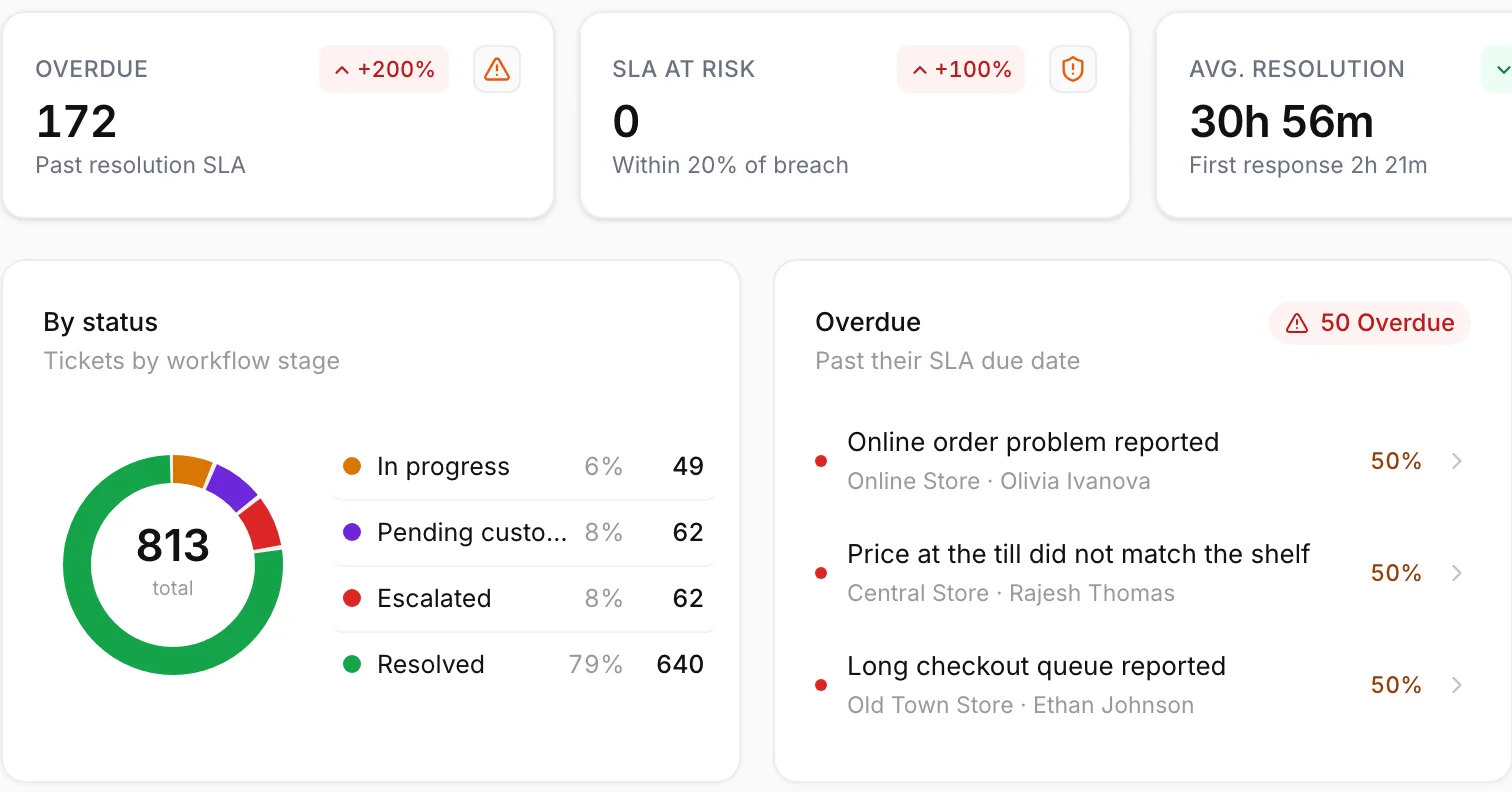
A bad or awful rating opens a ticket with an owner and an SLA. The resolution records the cause and the action, and a re-survey confirms the fix — see closed-loop ticketing.

Qmeter ticketing overview: overdue and SLA-at-risk counters, tickets by status, overdue list

Dashboard and ticket screens are the live Qmeter product on a demo account with illustrative data; survey screens show a sample client brand.

Where it runs

CSAT where the experience is decided

Four places where a two-second rating tells you more than a monthly survey.

What is included

What Qmeter's CSAT software includes

Product facts only. Everything here is in the platform today.

Smiley and star scales

Five faces or 3–10 stars, your own labels.

Per-service CSAT

Every question belongs to a service.

Branch, channel and time filters

Compare locations, channels and dates.

Drops by service

See which service drags the score down.

Sentiment on comments

AI summaries with your own OpenAI or Claude key.

SLI next to CSAT

One index to compare locations.

Automatic tickets on low scores

Owner, SLA timers and escalation.

Every channel, one template

Kiosk, QR, SMS, email, web and manual entry.

Public pricing

All plans listed on one page.

How it compares

CSAT software or a generic survey tool?

Where a general-purpose form builder usually stops, and what a CSAT platform adds.

Qmeter CSAT softwareTypical survey tools
Where the question is askedKiosk in kiosk mode, QR, SMS, email, web embed, pop-up, manual entryEmail and web links; kiosk mode and offline capture are rarely built in
What each score is tied toBranch, service, hour, channel and customer, automaticallyA form response; location and service need extra fields and manual analysis
ReportingTop-2-box CSAT per service and branch, trend, distribution, SLI, NPS, AI summaryResponse counts and averages per form
After a low scoreA ticket with owner, SLA timers, escalation, root cause and a re-surveyA notification, with the follow-up tracked elsewhere
Customer profileCSAT, NPS, SLI, sentiment, surveys and tickets on one 360° profileResponses listed per form

General observations about product categories, not claims about any named vendor; check each product's current documentation. Evaluating a survey tool? See the SurveyMonkey alternative page.

ROI of a measured moment

The return: retained customers, faster fixes, fewer surprises

One cited finding, then your own numbers. Move the sliders; every figure comes from your inputs.

25–95%

Research by Bain & Company published in Harvard Business Review found that increasing customer retention rates by 5% can raise profits by 25% to 95%.

Bain & Company / Harvard Business Review

CSAT measured per service is the earliest retention signal you have: the customer who rated the checkout 'Bad' today is the one who quietly stops coming next month.

6
3,000

Sizes your plan; plans are billed by responses per year.

25

Bad and awful ratings, plus the customers who leave without saying anything.

€300

What one regular customer is worth to you over a year.

10%

Example: if you save 10 out of every 100 you catch, set 10%.

Your estimated return
€50,000

protected per year, after Qmeter's cost

Keeping just 14 customers a year — across all 6 locations — covers the entire cost. Everything above that is return.
Customers kept per year (est.) — 180€54,000
Web Feedback plan — 50k responses− €4,000
estimated return: over 10× what you pay

An estimate computed from your own inputs — not a guarantee or forecast of results. Adjust the sliders to match your numbers.

Fixes go where the score points

Per-service CSAT shows whether the problem is the queue, the staff or the stock, so the manager's afternoon goes to the right thing.

One view instead of a weekly report

Branch comparison, drops by service and open tickets are on screen the same day, replacing the hours spent assembling a satisfaction report by hand.

The investment side is public

Qmeter's list prices are on one page: a Web Feedback plan billed on responses, a Device License for kiosks, and custom Enterprise agreements. Set that against the value of one regular customer you keep.

See transparent pricing →
Data protection

Anonymous ratings, protected identities

A smiley needs no personal data. When a survey collects contact details, the platform treats them as a liability to protect.

Anonymous by default

Ratings carry no personal data unless you add customer fields to the survey.

PII masking

Email and phone are masked in the interface and hidden from AI analysis; revealing them needs a permission and is audited.

GDPR workflows

Deletion requests and retention-based anonymisation are built into the platform.

On-premise option

Enterprise deployments can run Qmeter on your own servers with the same feature set.

The full data-protection picture is on the security & GDPR page.

FAQ

CSAT software, answered

Short, honest answers. For anything else, talk to our team.

What is CSAT software?›

CSAT software asks customers to rate a specific interaction, typically on a five-point smiley or star scale, calculates the customer satisfaction score as the share of positive ratings, and reports it by location, service and time. Qmeter adds automatic tickets on low scores, so the software manages the follow-up as well as the measurement.

Keep exploring

Where to go deeper

Get started

Measure the moment. Fix it the same day.

Start a 14-day free trial, no credit card. Build a smiley survey, put it on a kiosk or a QR code, and see per-service CSAT on the dashboard today.

See pricing