01
Put the NPS question where it belongs
Drop the 0–10 Net Promoter Score question into any survey and set your own end labels. Add a follow-up — 'What is the main reason for your score?' — that appears only for scores of 0–6.
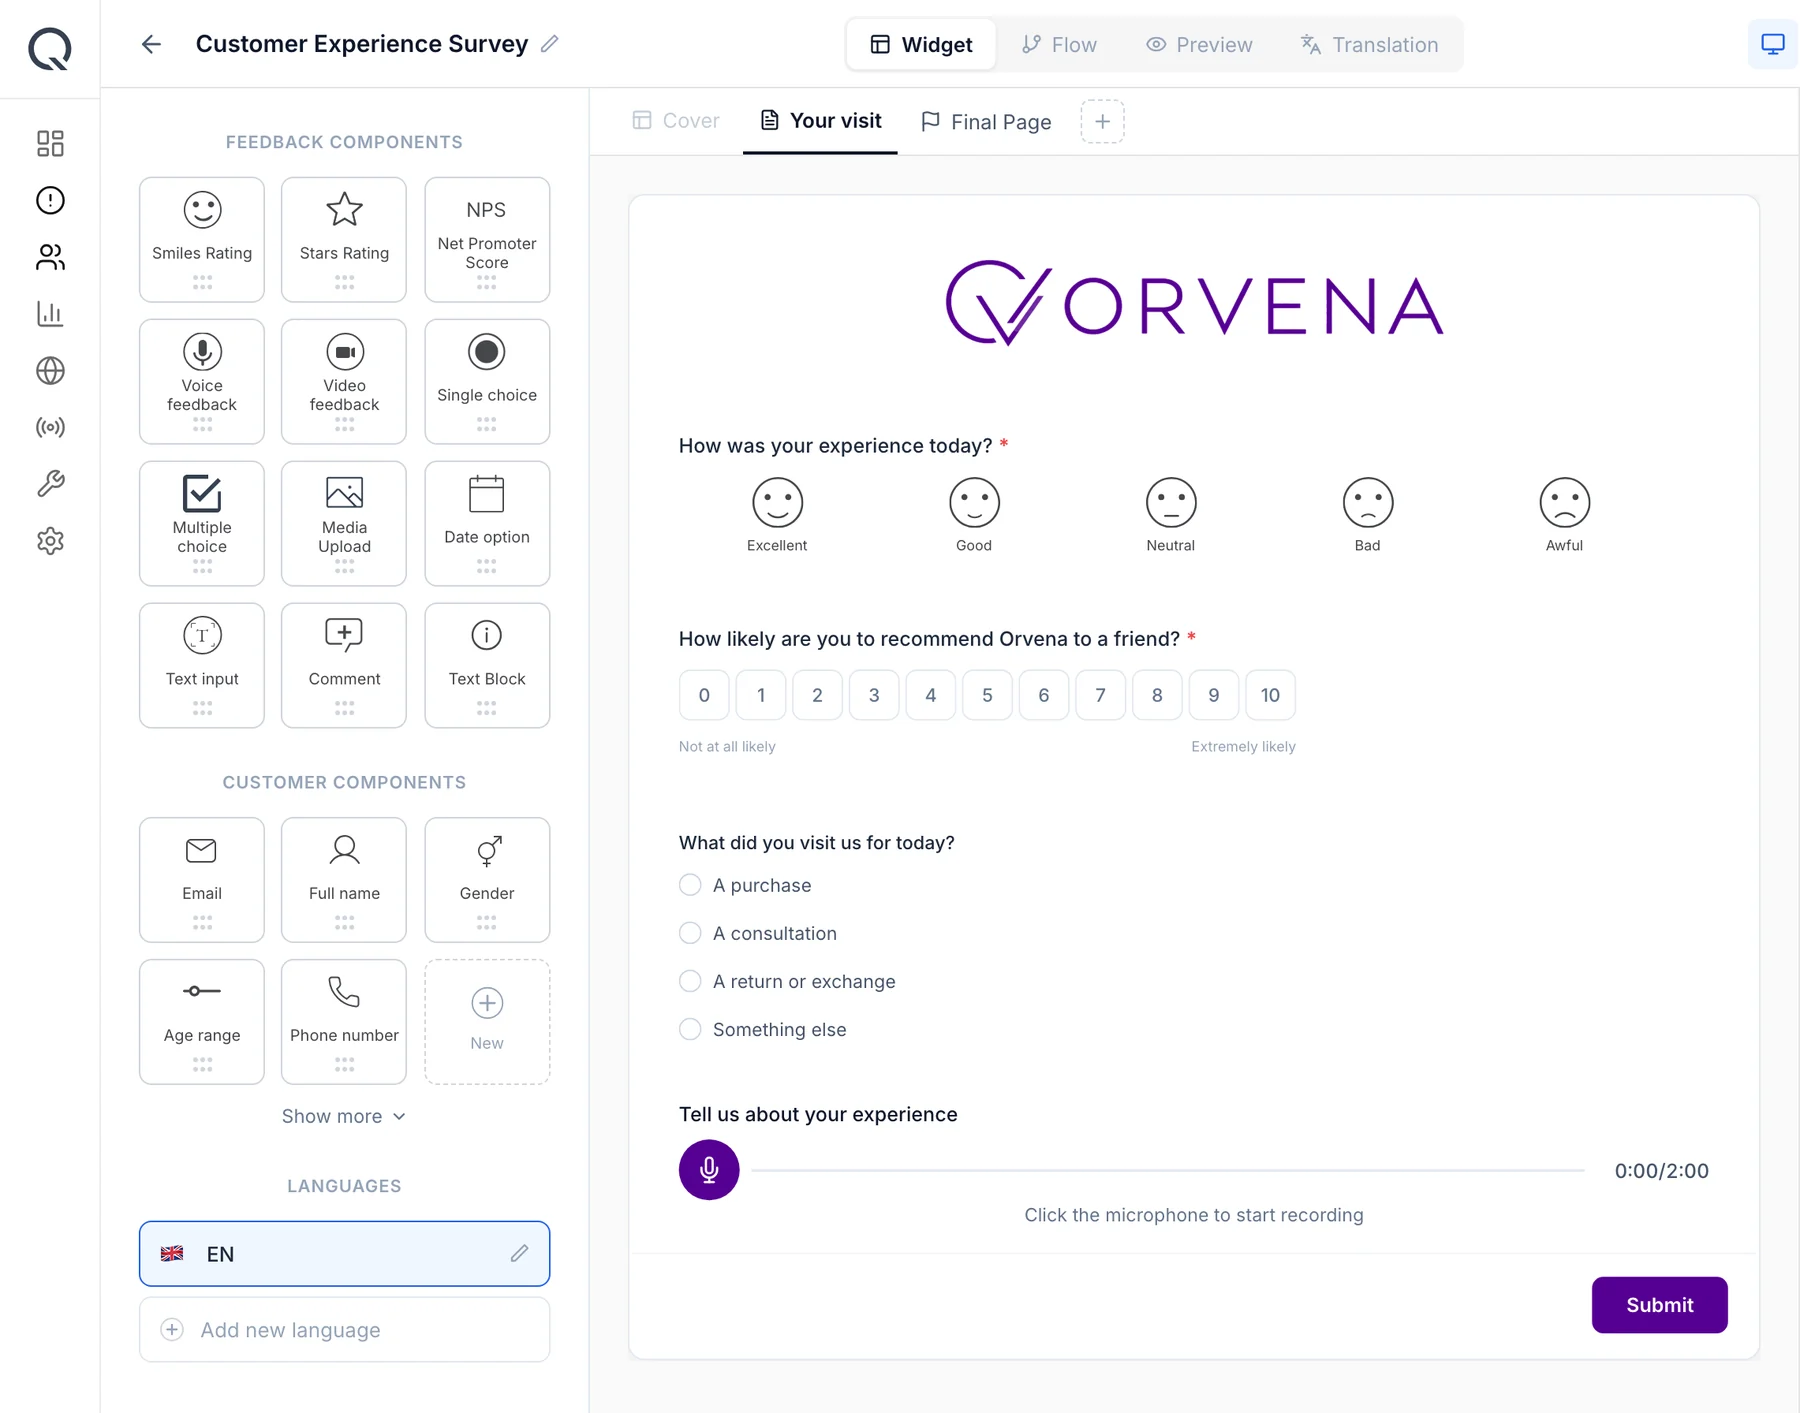
Qmeter is NPS software for multi-location businesses: the Net Promoter Score question goes out by SMS, email, QR code, web or kiosk, the score is tracked live by branch, service and week, and every detractor automatically becomes a ticket with an SLA. The number arrives together with the fix.
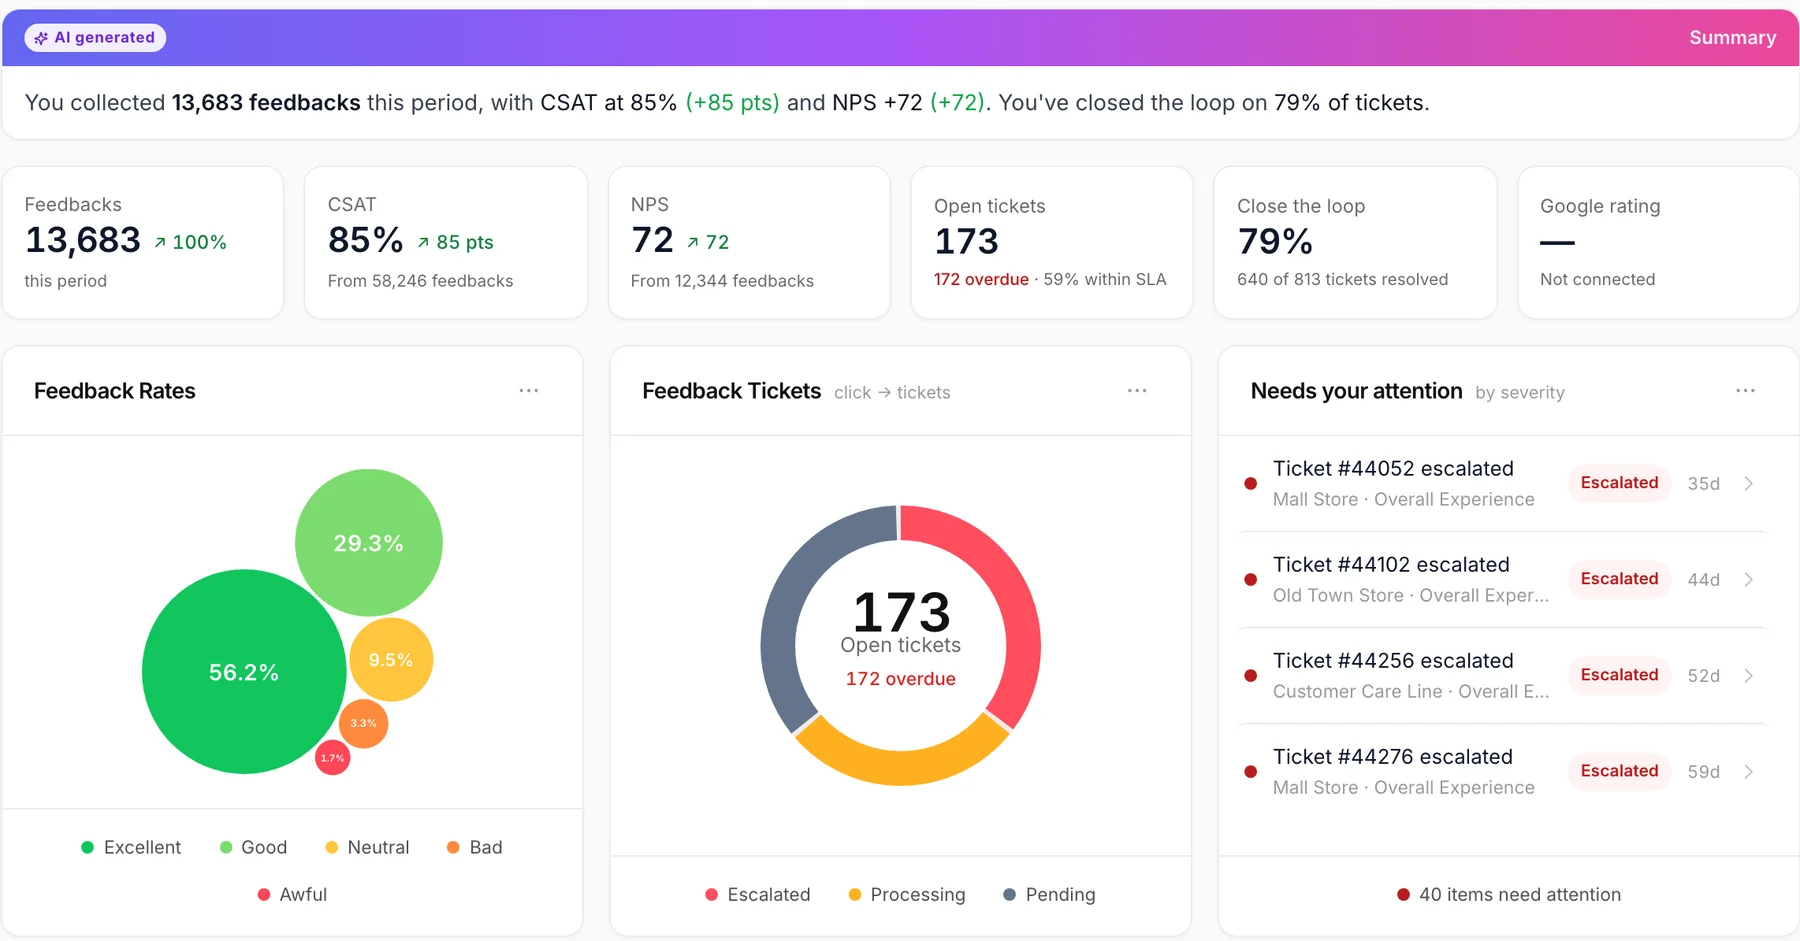
Promoters, passives and detractors sit next to CSAT and SLI on one dashboard, because a single score never explains itself.

Net Promoter Score (NPS) is one question — "How likely are you to recommend us?" on a 0–10 scale. NPS software asks it at the right moment, calculates promoters minus detractors, and makes sure every detractor gets a reply.
Differences and benchmarks: CSAT vs NPS vs CES.
Four steps on one platform. The screens below are the live product on a demo account.
Drop the 0–10 Net Promoter Score question into any survey and set your own end labels. Add a follow-up — 'What is the main reason for your score?' — that appears only for scores of 0–6.
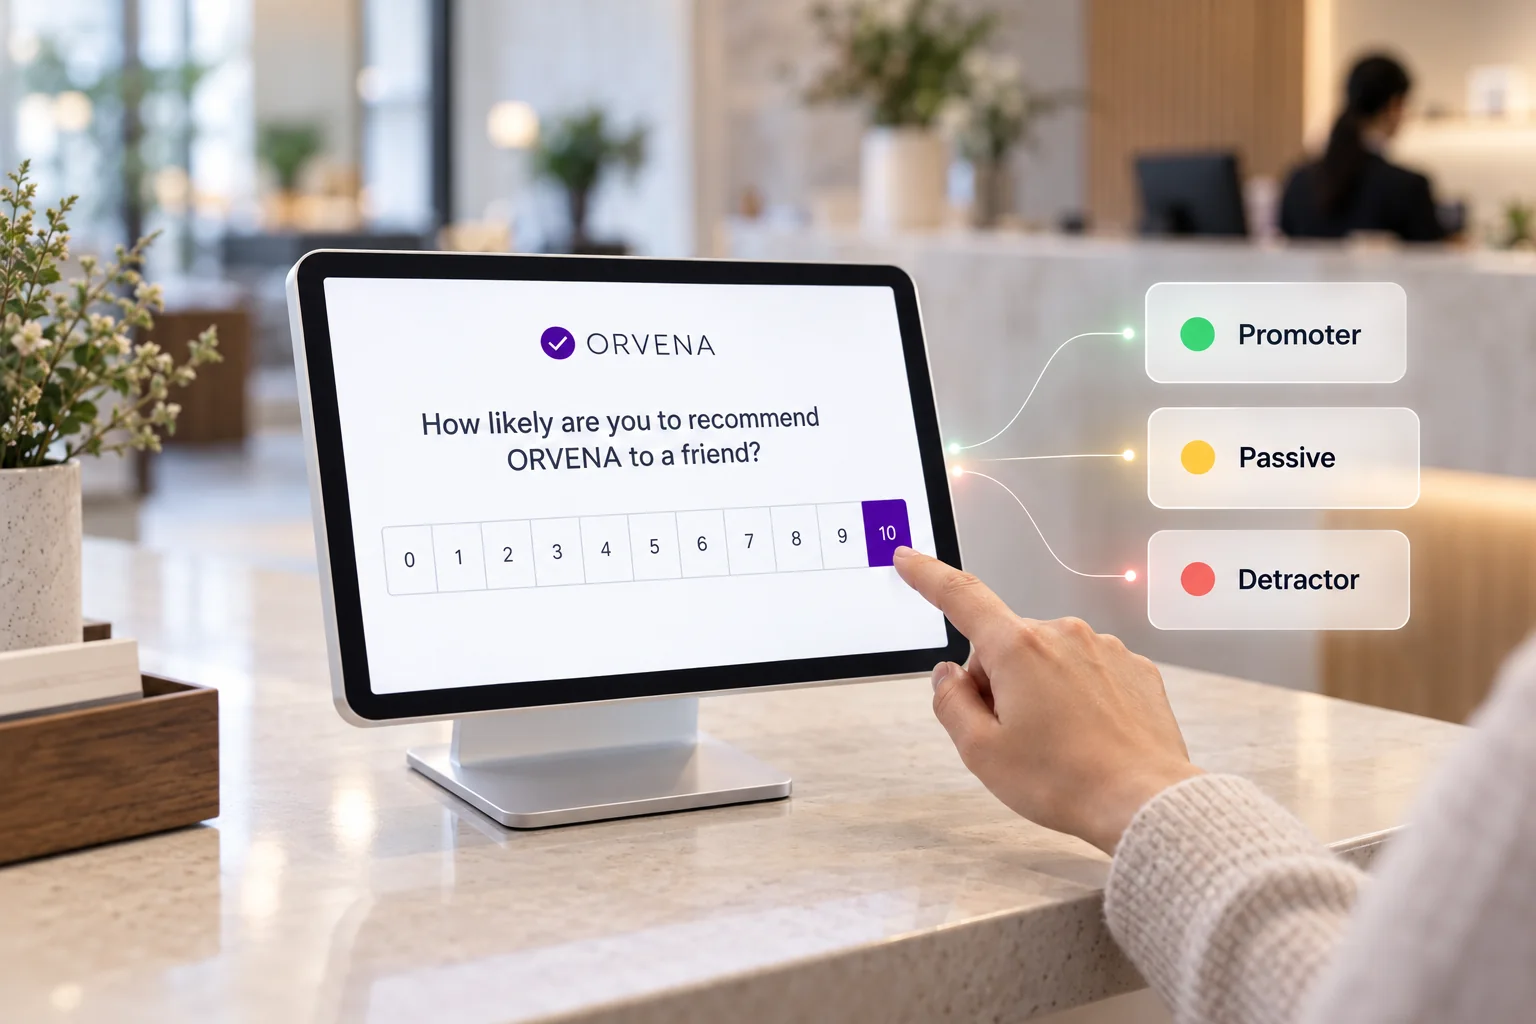
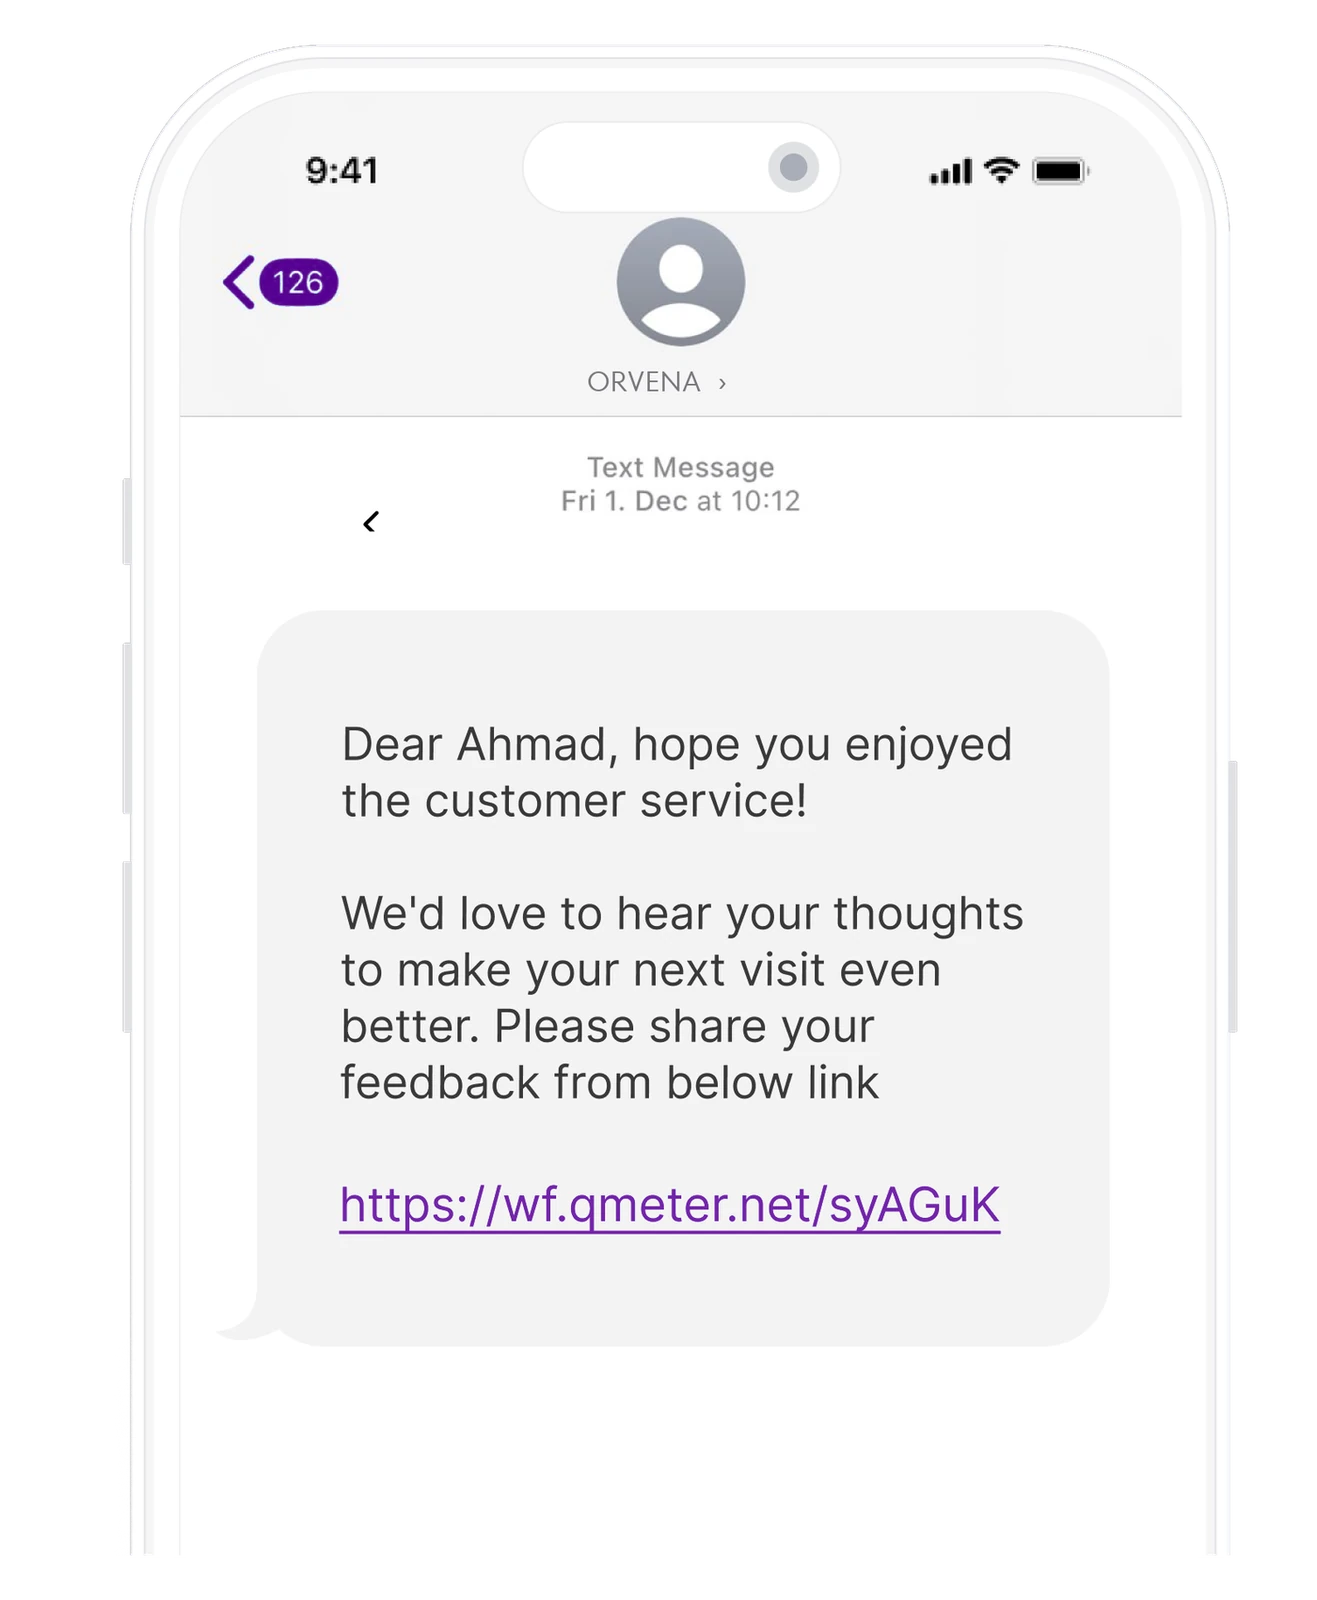
Send the survey by SMS or email with campaigns, print a QR code on the receipt, embed it on the website or close the in-store survey on a kiosk. Every channel writes to the same dataset.
See NPS next to CSAT and SLI, with the promoter, passive and detractor split by branch, service and week. An AI summary tells you what moved and why.
Every detractor becomes a ticket with an owner, a priority and an SLA. The reply goes out from the ticket, and a re-survey after resolution confirms the customer was won back — see closed-loop ticketing.
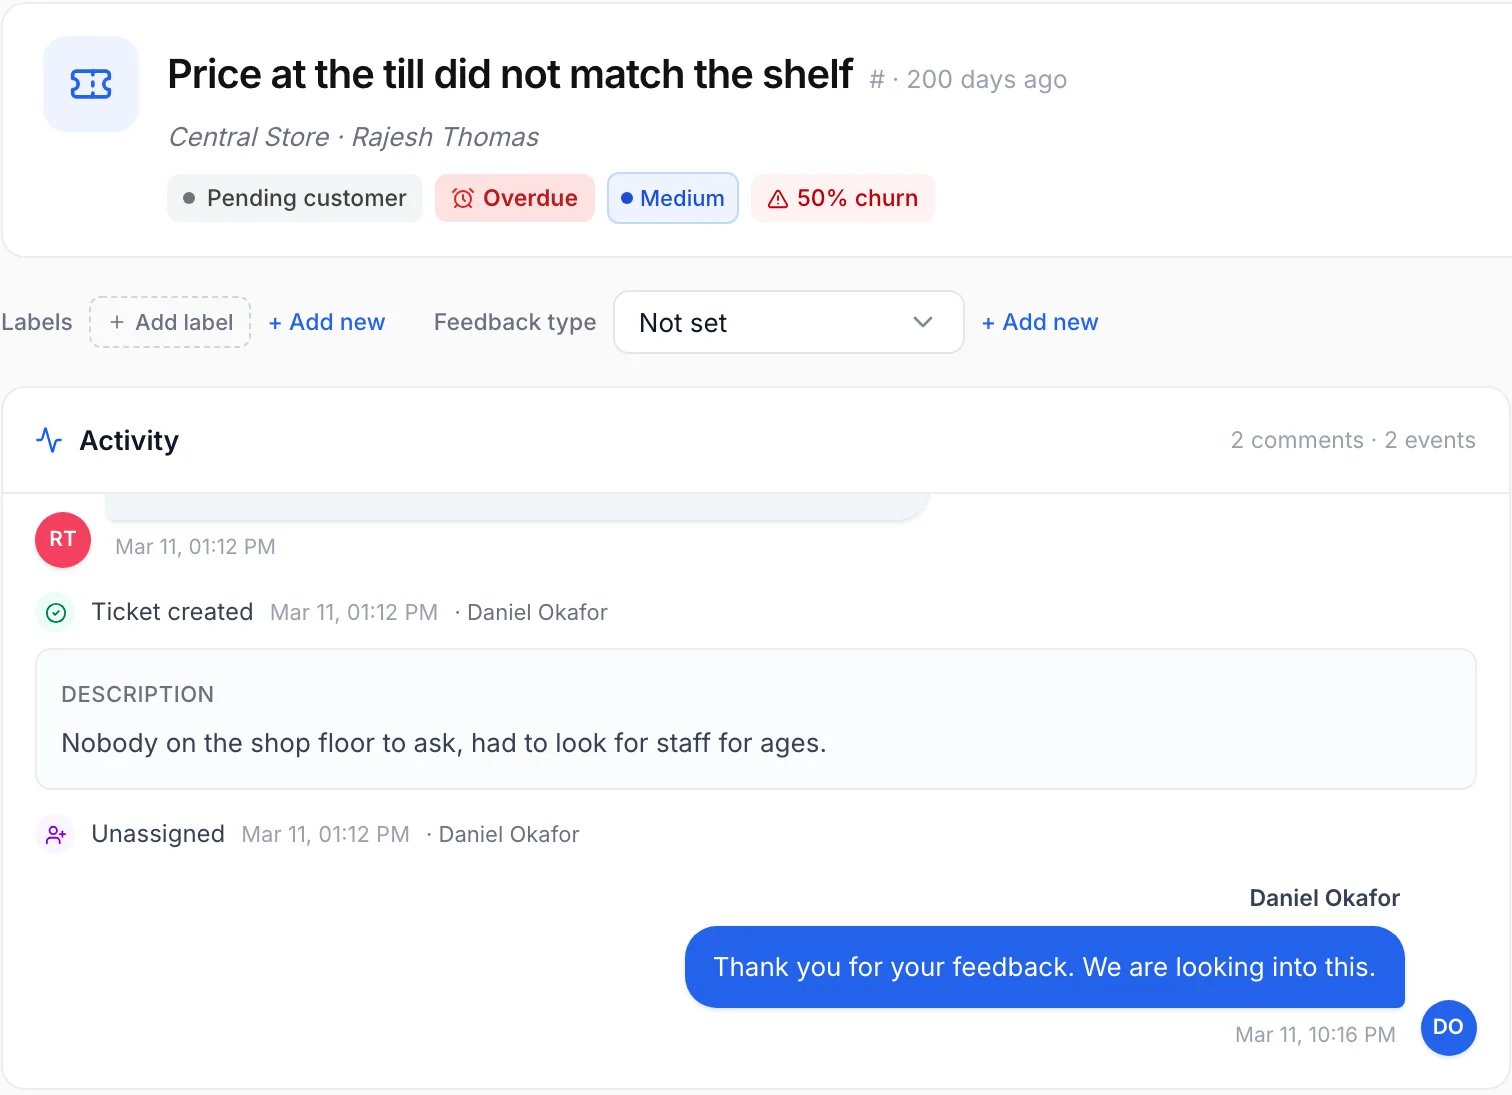
Dashboard and ticket screens are the live Qmeter product on a demo account with illustrative data; survey screens show a sample client brand.
NPS only predicts loyalty when it is asked where loyalty is decided. Four places Qmeter customers ask it.
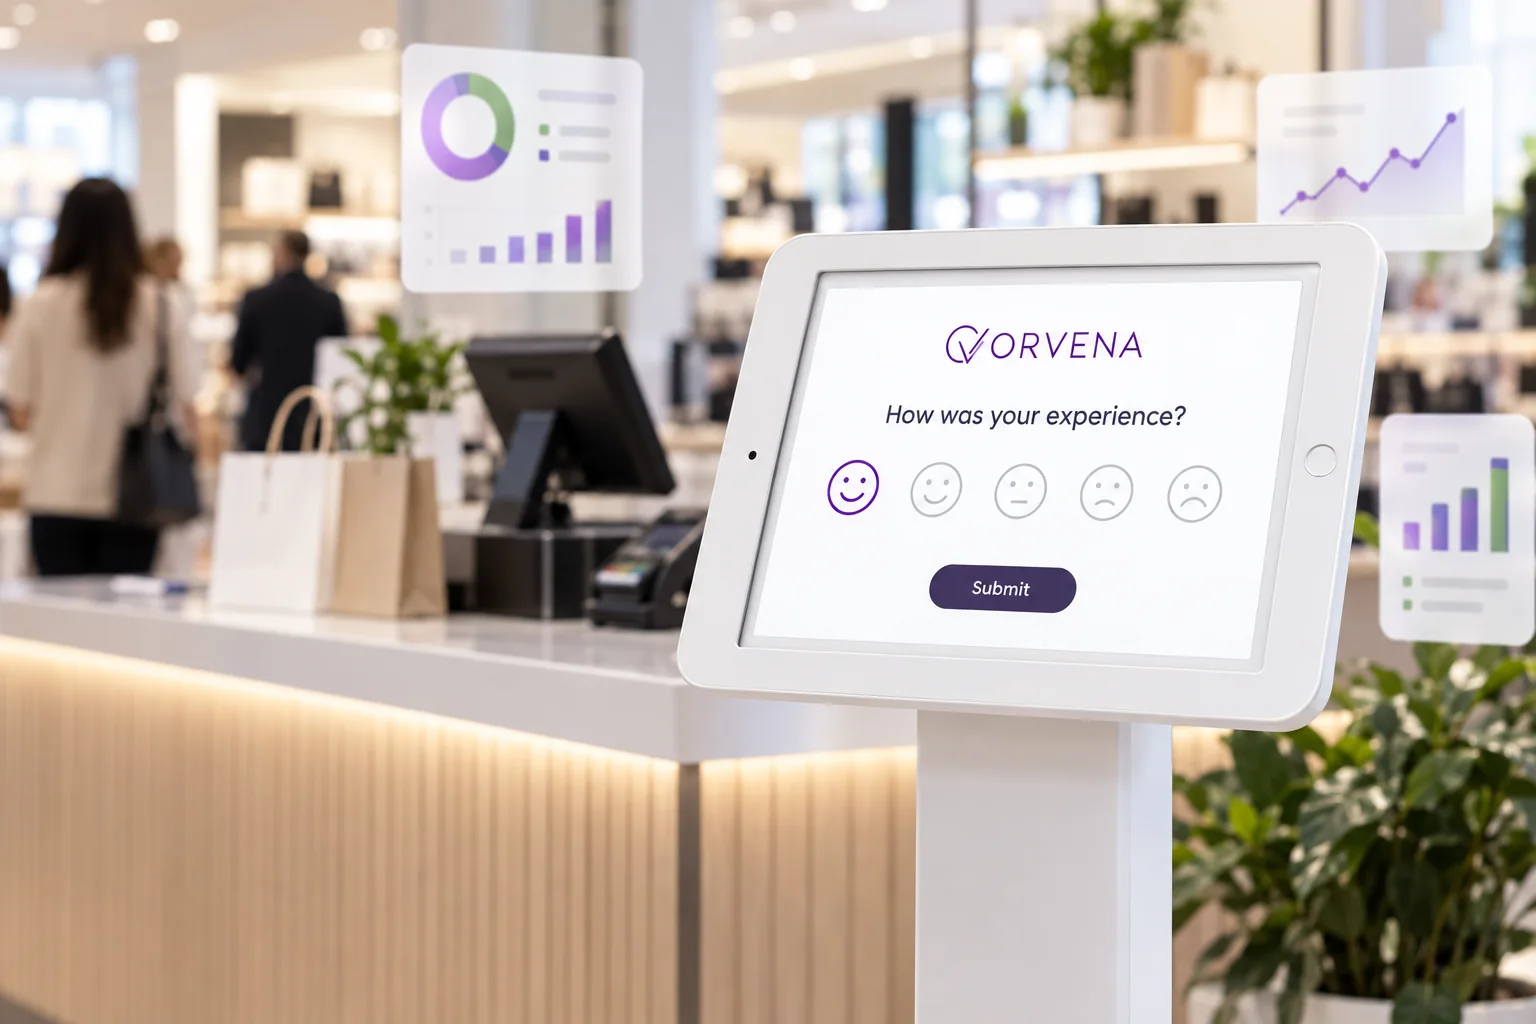
A kiosk at the exit or a QR code on the receipt closes with the 0–10 question, so store-vs-store NPS is live by evening.
Retail feedback →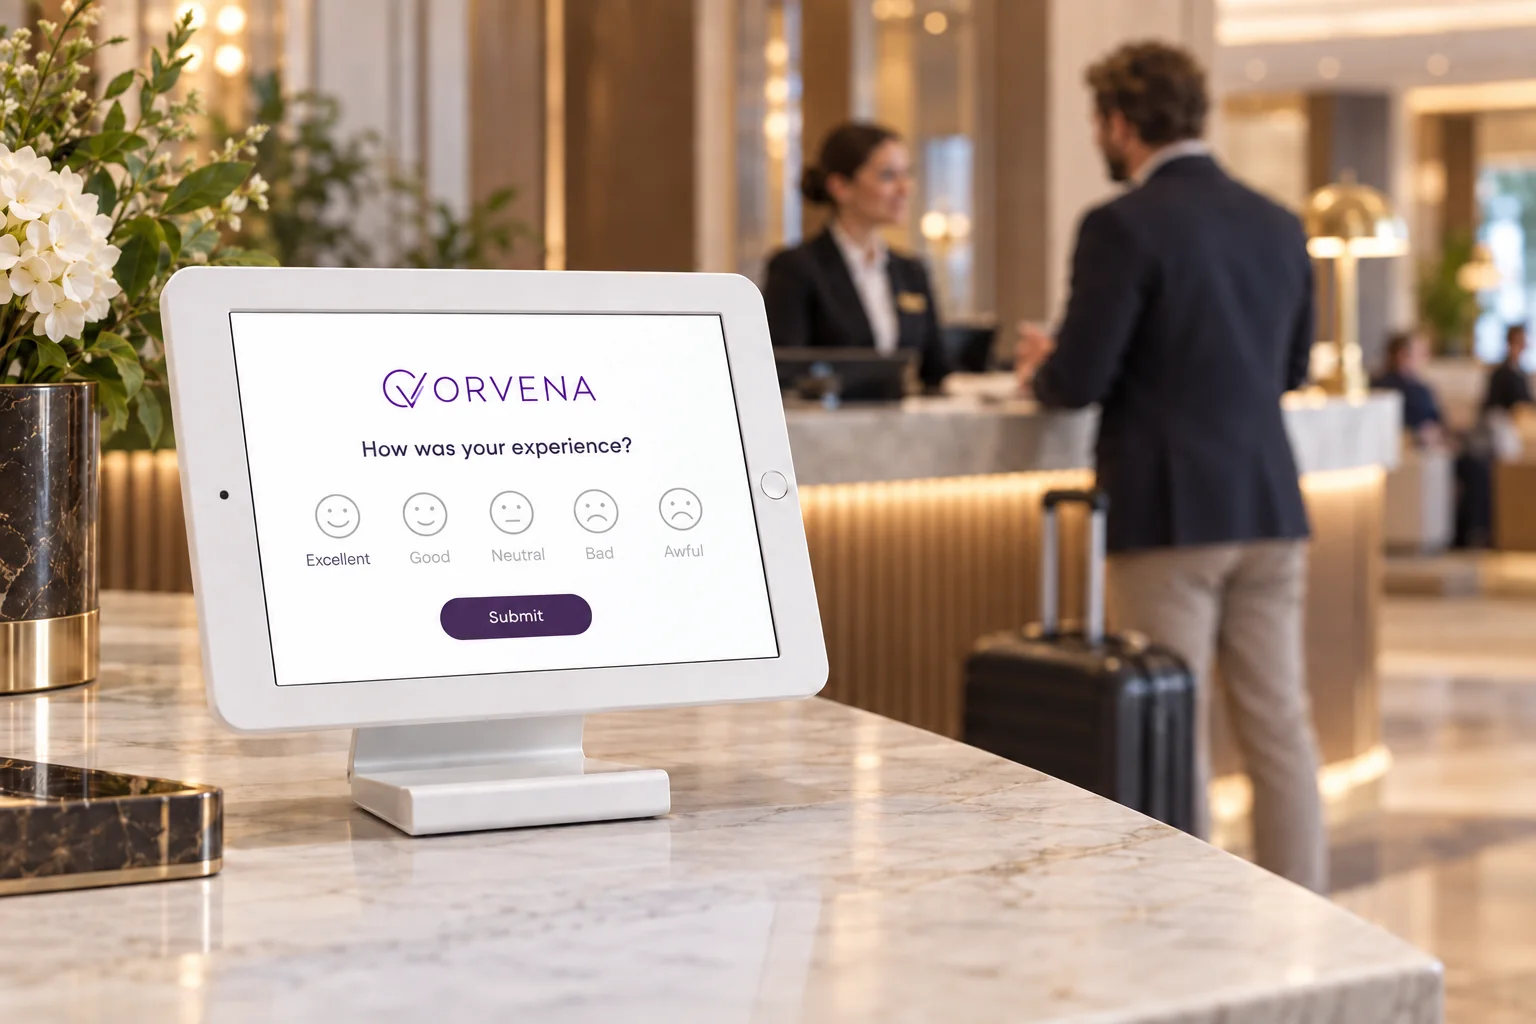
An SMS on departure day asks the question while the stay is fresh; detractors reach the duty manager before the review does.
Hospitality feedback →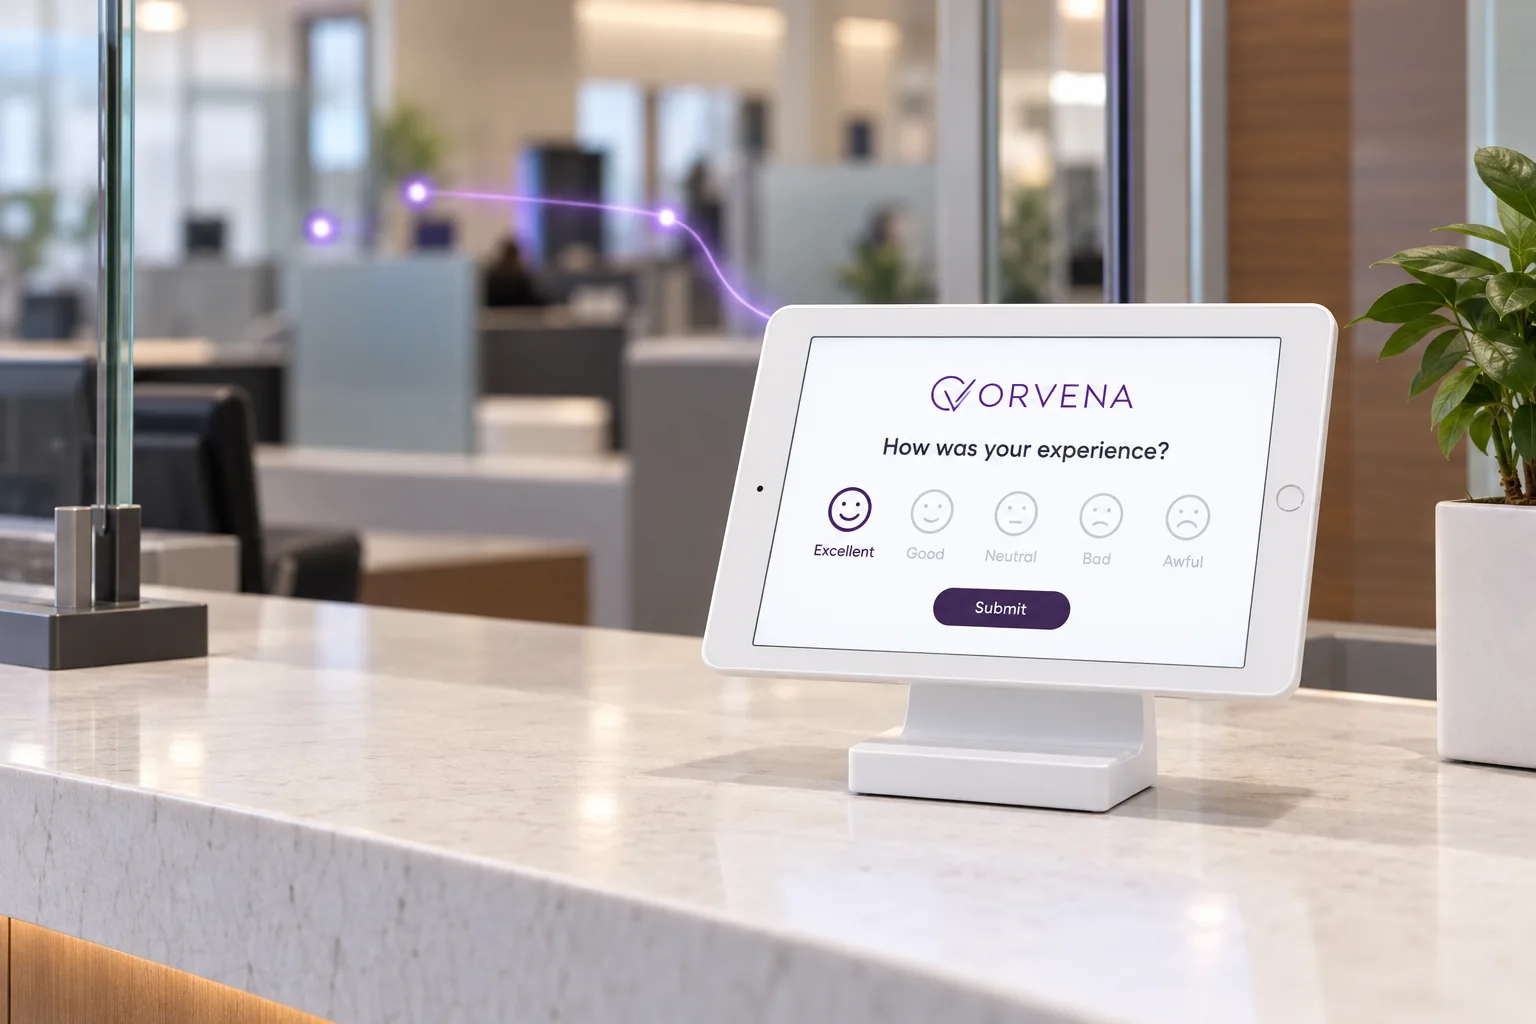
The teller-desk tablet or a follow-up SMS scores the desk and the service; complaints route with regulator-grade timers.
Bank branch feedback →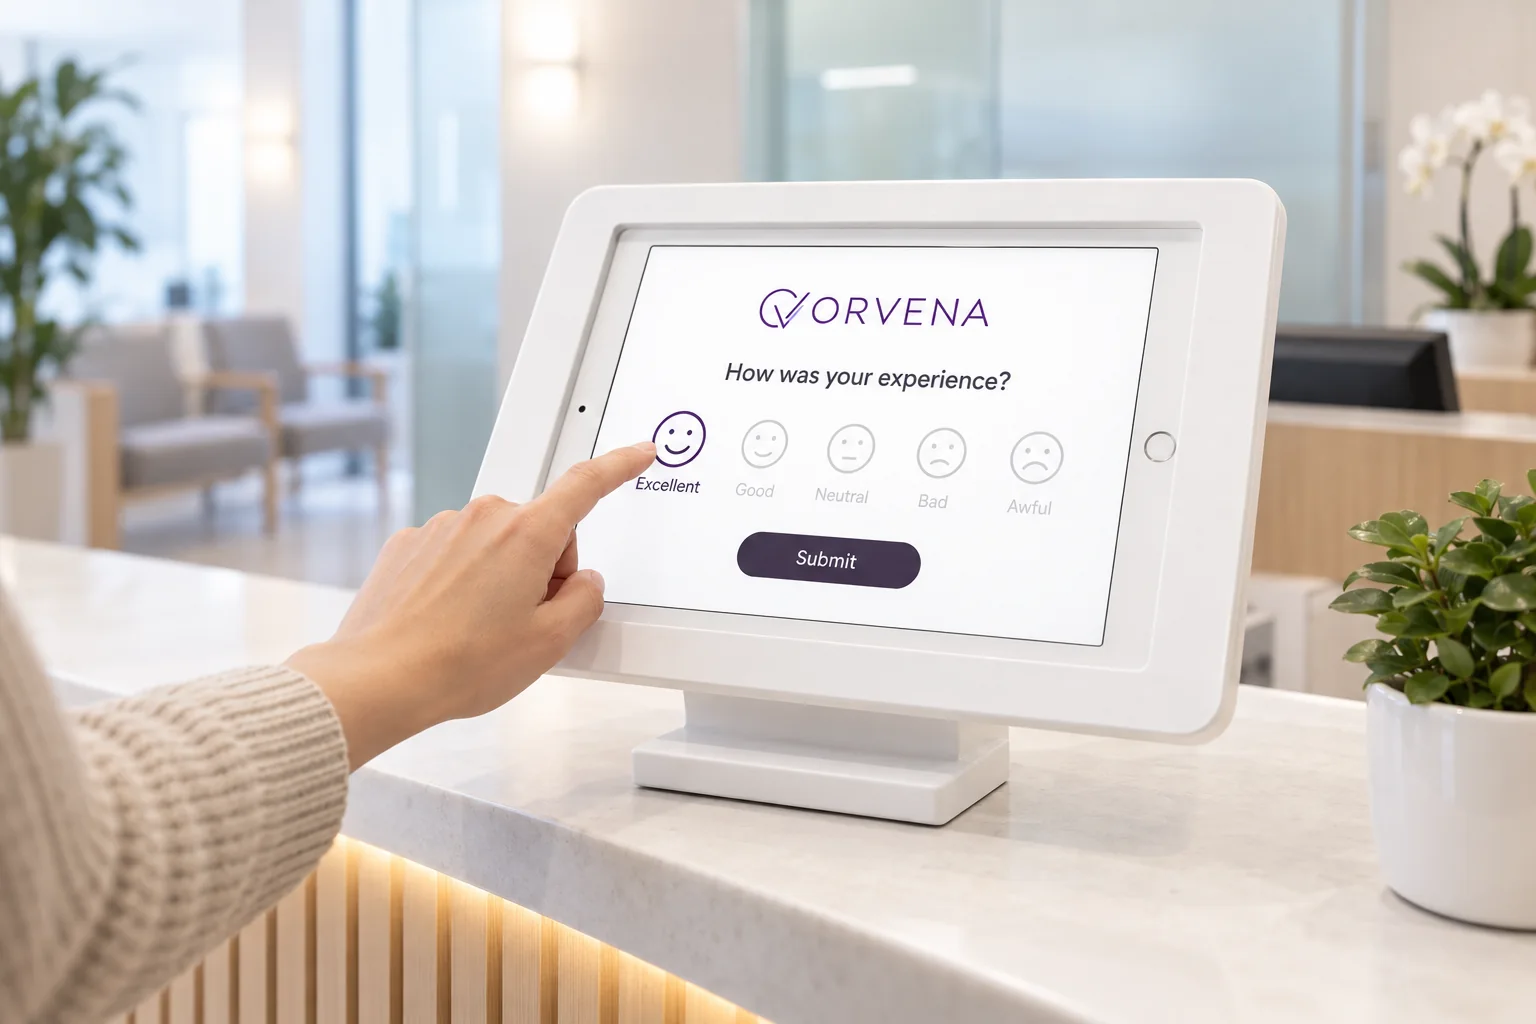
A tap at reception or an SMS after discharge gives patient NPS per department without a paper questionnaire.
Patient feedback →Product facts only. Everything here is in the platform today.
0–10 scale, your own labels, conditional follow-ups.
After a visit, or as a periodic SMS or email wave.
By branch, service, template and date.
An automatic league table between branches.
Owner, timers, escalation and an audit trail.
NPS history next to CSAT, SLI and tickets.
Sentiment and summaries with your own AI key.
Pivot NPS by any dimension and export it.
All plans listed on one page.
Three ways teams run NPS today, and what each one leaves out.
| Qmeter NPS software | Typical alternatives | |
|---|---|---|
| Where the question is asked | Kiosk, QR, SMS, email, web embed and pop-up from one template | Survey tools usually cover email and web links; spreadsheets depend on whatever was exported |
| Scope of each answer | Branch, service, template, channel and customer, automatically | Often a single overall number per wave, with manual tagging for anything more |
| What happens to a detractor | A ticket with owner, SLA timers, escalation and a re-survey after resolution | An alert email at best; the follow-up is tracked in another tool or not at all |
| NPS next to other metrics | CSAT, SLI and sentiment on the same dashboard and customer profile | NPS in one tool, CSAT in another, comments in a third |
| Pricing | Public price list | Enterprise CX suites are commonly quote-only |
General observations about product categories, not claims about any named vendor; check each product's current documentation. Evaluating an enterprise suite? See the Qualtrics alternative and Medallia alternative pages.
One cited finding, then your own numbers. Move the sliders; every figure comes from your inputs.
Research published in Harvard Business Review puts the cost of winning a new customer at five to twenty-five times the cost of keeping an existing one.
Harvard Business ReviewA detractor you call back this week costs a ticket. A detractor you discover in next quarter's report costs a replacement customer.
Sizes your plan; plans are billed by responses per year.
Your current detractor count, or an estimate from complaints and low ratings.
What one regular customer is worth to you over a year.
Example: if you recover 10 out of every 100 you contact, set 10%.
protected per year, after Qmeter's cost
An estimate computed from your own inputs — not a guarantee or forecast of results. Adjust the sliders to match your numbers.
The conditional follow-up and AI comment analysis tell you why the number moved, so the action goes where the data points instead of into a general training day.
NPS is on the dashboard the same day, by branch, next to the tickets it created. The quarterly deck becomes a summary of what was already fixed.
Qmeter's list prices are on one page: a Feedback Responses plan billed on responses, a Device License for kiosks, and custom Enterprise agreements. Set that against the lifetime value of one recovered detractor.
NPS by SMS and email means phone numbers and addresses in the system. The platform treats them as a liability to protect.
Email and phone are masked in the interface and hidden from AI analysis; revealing them needs a permission and writes an audit event.
Every ticket change and every PII reveal is logged, so first-response and resolution times are provable, not remembered.
Deletion requests and retention-based anonymisation are built into the platform, not bolted on.
Customer data cannot leave your infrastructure? Enterprise deployments can run Qmeter on your own servers.
The full data-protection picture is on the security & GDPR page.
NPS software asks the 0–10 'How likely are you to recommend us?' question on your channels, calculates the Net Promoter Score (promoters minus detractors), shows the distribution by branch, service and time, and manages the follow-up with detractors. Qmeter adds closed-loop tickets, so every detractor is a tracked case with an SLA.
What each metric measures, the differences, benchmarks and when to use which.
→Relational NPS waves to a list or a segment, with setup, review and launch.
→How a detractor becomes a ticket with SLA timers, escalation and an audit trail.
→The satisfaction score for the moment of experience, per service and branch.
→The full platform: builder, channels, analytics and customer profiles.
→Which metrics to track and a five-step plan to launch a VoC programme.
→Start a 14-day free trial. Build the NPS survey, send the first wave by SMS or email, and watch detractors become tickets today.