NPS survey template
✓ Cloud or on-premise · ✓ Kiosk, QR, SMS, email and web · ✓ Live in one day
An NPS survey template starts with the standard question — “How likely are you to recommend [company] to a friend or colleague?” on a 0–10 scale — followed by one open “why” question. Add two or three driver questions only if you will act on them, and route every detractor (0–6) to a follow-up.
The NPS survey template
The Net Promoter Score was introduced by Fred Reichheld of Bain & Company in the 2003 Harvard Business Review article “The One Number You Need to Grow”. Its strength is that the core question never changes, so scores are comparable across time, locations and channels. Everything around that question — the follow-ups — is where a template earns its value.
This template uses score-based follow-ups: promoters, passives and detractors each see a slightly different second question. That small change tends to produce more specific comments than a single generic “why?”.
Full version (QR code, email, SMS link or web) — 8 questions
- How likely are you to recommend [company] to a friend or colleague?
Answer type: 0–10 scale, labelled “Not at all likely” (0) and “Extremely likely” (10), required
Do not change the wording or the scale — that is what keeps your NPS comparable. - Promoters (9–10): What do you value most about us?
Answer type: Open text, optional
Shown with show-if logic only to scores of 9 or 10. - Passives (7–8): What would it take for you to give us a 9 or 10?
Answer type: Open text, optional
Passives are the easiest group to convert; this question tells you how. - Detractors (0–6): We are sorry to hear that. What disappointed you most?
Answer type: Open text, optional - Which of these influenced your score the most?
Answer type: Multiple choice: Staff · Speed of service · Product or service quality · Price and value · Ease of doing business · Other
Tagging the reason with one tap makes the open comments much easier to count. - How satisfied were you with your most recent interaction with us?
Answer type: 1–5 smileys
Separates relationship loyalty (NPS) from the last transaction (CSAT). - How long have you been a customer?
Answer type: Single choice: Less than 6 months · 6–24 months · More than 2 years
Skip it if you already know this from your customer records. - May we contact you to follow up on your answer?
Answer type: Yes / No + phone or email on Yes
Essential for detractors — without it you can only fix the cause, not the relationship.
Questions 2–4 are three versions of the same slot; each respondent sees only one of them, so the customer experiences a six-question survey.
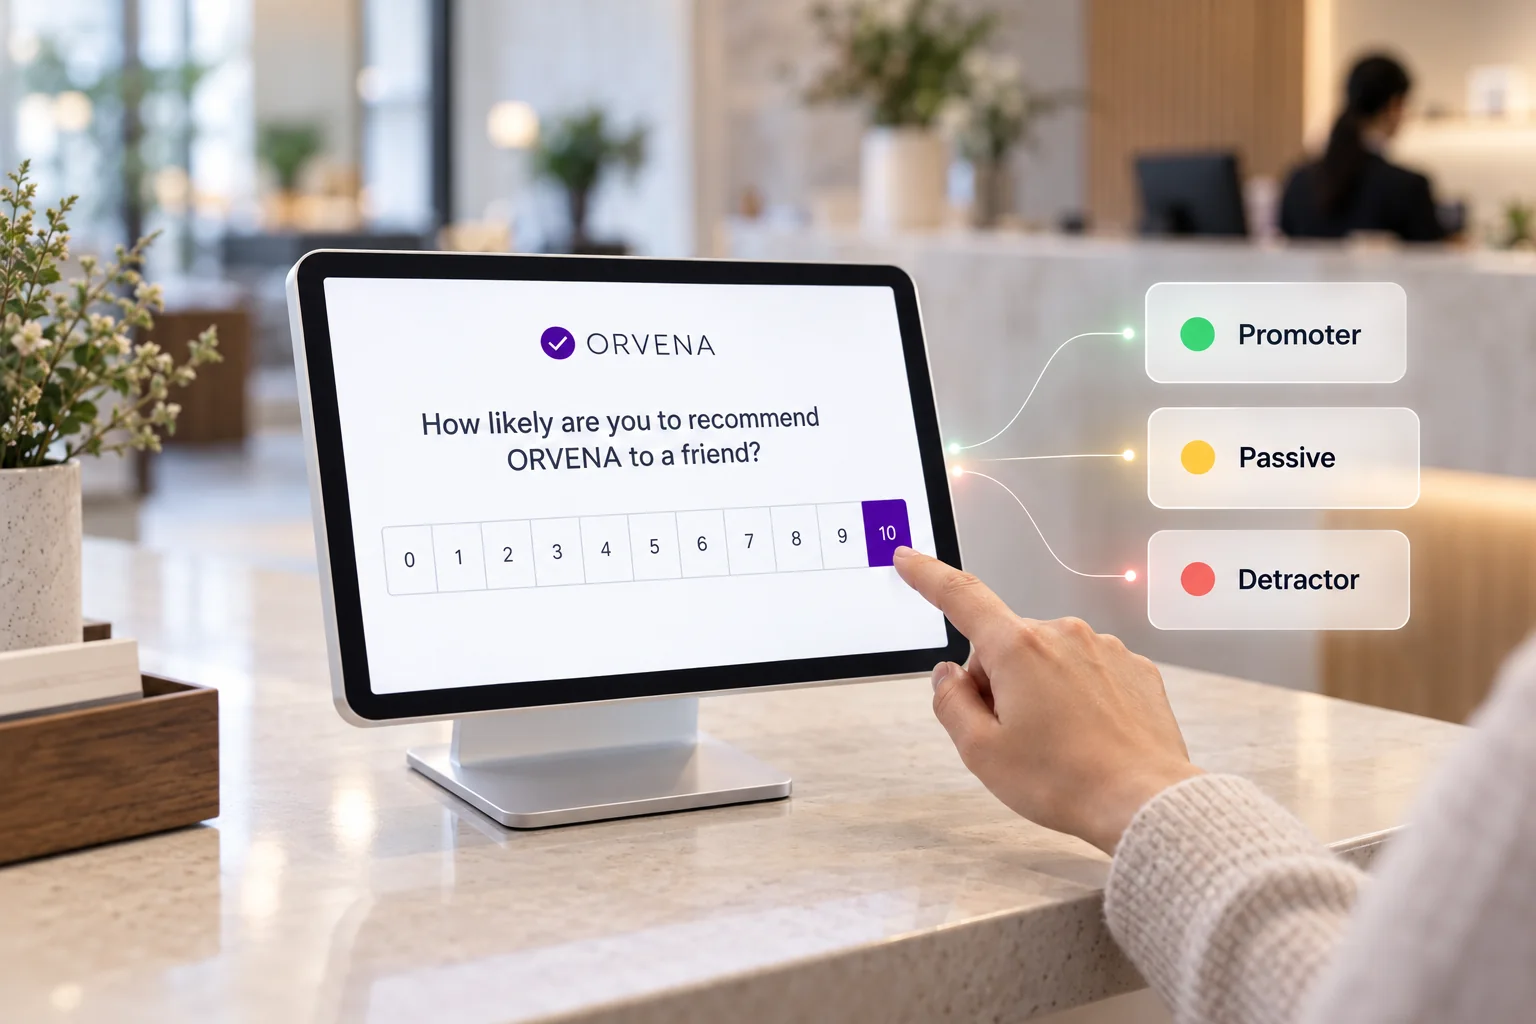
Short version for a kiosk or tablet (3 questions)
On a kiosk, the NPS question works best as the only rating. Pair it with one tap for the reason and an optional contact request:
- How likely are you to recommend us to a friend or colleague?
Answer type: 0–10 scale, required - What influenced your score most?
Answer type: Multiple choice (Staff · Speed · Quality · Value · Other) - Would you like us to contact you? (shown only for 0–6)
Answer type: Yes / No + phone number
Relationship NPS or transactional NPS?
The same template supports two different programmes, and it helps to decide which one you are running before launch:
- Relationship NPS asks your customer base every few months how they feel about the company overall. It is sent by email or SMS to a sample of customers, is not tied to a specific visit and is best for tracking brand loyalty over quarters.
- Transactional NPS asks right after a specific interaction — a branch visit, a delivery, a support call. It is triggered by the event, collected by kiosk, QR or SMS, and is best for managing locations and teams.
Most multi-location organisations run both: relationship NPS for the board, transactional NPS for branch managers. Keep them in separate reports, because the scores are not directly comparable — people rate a single good visit differently from a long relationship. The difference between transactional and relationship measurement is explained further in our guide to transactional feedback.
When and where to run it
Where you ask changes who answers. Choose the channel to match the type of NPS you are measuring:
- Right after a branch or store visit — kiosk at the exit, short version. Transactional NPS by location; expect a high volume of short answers.
- Table, counter or waiting area — QR code, full version. Good for longer stays such as restaurants, clinics and service halls.
- Within a few hours after a service — SMS link, full version. Ideal when the visit is recorded with a phone number, e.g. bookings or deliveries.
- Every 3–6 months to active customers — email campaign, full version. Relationship NPS; do not survey the same customer more often than that.
- Inside your app or customer portal — web widget, short or full version. Trigger after a completed task, not on login.
How to analyse the results
Group the 0–10 answers into promoters (9–10), passives (7–8) and detractors (0–6). NPS is the percentage of promoters minus the percentage of detractors, giving a score between −100 and +100. Example: 300 responses, 150 promoters (50%), 90 passives (30%), 60 detractors (20%) — NPS is 50 − 20 = +30. You can check your own numbers with the NPS calculator, and what NPS is explains the method in depth.
Then break the score down:
- By location and channel. Compare branches only within the same channel; kiosk scores and email scores come from different moments.
- By reason (question 5). Count the reasons chosen by detractors. The top two reasons usually explain most of the gap.
- By customer tenure. A falling score among long-standing customers is an early churn warning that a stable overall NPS can hide.
- Over time. Track a rolling 30- or 90-day NPS. Single weeks at small locations move too much to act on.
Treat the number as a direction, not a verdict. A move from +20 to +28 on the same template, channel and audience is meaningful; a comparison with another company's published score usually is not.
Closing the loop on low scores
NPS only pays off when detractors hear back. A simple, enforceable loop:
- Every score from 0 to 6 creates a follow-up ticket for the location or account owner.
- Scores of 0–3, or comments containing words like “complaint” or “never again”, are set to high priority and escalate if not answered on time.
- The owner contacts the customer, fixes what can be fixed and records the root cause.
- Promoters get a thank-you — and, where it fits, an invitation to leave a public review.
Each step is described in our closed-loop feedback guide.
Use this template in Qmeter
Qmeter has a dedicated Net Promoter Score component (0–10) in its Template Builder, show-if logic for the promoter / passive / detractor follow-ups, and automatic ticket generation rules that can trigger on NPS rating levels and keywords. NPS is calculated live on the dashboard by branch, channel and period, and the same template can run on kiosks, QR codes, SMS and email campaigns at once. See the NPS software page for the full workflow, or start with the 14-day free trial.
Frequently asked questions
What is the standard NPS question?
How likely are you to recommend [company] to a friend or colleague? It is answered on a 0–10 scale where 0 means not at all likely and 10 means extremely likely. Keep that wording so your score is comparable over time.
How many questions should an NPS survey have?
Two is the minimum: the 0–10 question and an open follow-up asking why. Most NPS surveys work best with three to six questions in total. On a kiosk, keep it to three.
Can I change the NPS scale to 1–5 or 1–10?
No. The Net Promoter calculation depends on the 0–10 scale and the 9–10 / 7–8 / 0–6 grouping. On another scale the result is no longer an NPS.
How often should I send an NPS survey?
Transactional NPS runs continuously after each interaction. Relationship NPS is usually sent every three to six months, and the same customer should not receive it more often than that.
What is a good NPS?
Anything above zero means you have more promoters than detractors. Above +30 is generally considered good and above +50 strong, but the most reliable benchmark is your own trend on the same template and channel.
Should detractors always be contacted?
Every detractor who left contact details should get a reply, ideally within one or two working days. Those who stayed anonymous still count: their reasons feed your root-cause analysis.
Measure it at every location — live in one day
Feedback kiosks, QR and web surveys, SMS and email, real-time alerts and follow-up tickets in one platform. 14-day free trial.
✓ 15 minutes · ✓ No commitment · ✓ A real CX person