What Is CSAT? The Customer Satisfaction Score Explained
✓ Cloud or on-premise · ✓ Kiosk, QR, SMS, email and web · ✓ Live in one day
CSAT (customer satisfaction score) measures how satisfied customers are with a specific interaction, usually on a 1–5 scale. The CSAT score is the percentage of respondents who choose 4 or 5: satisfied responses ÷ all responses × 100. It is the most direct way to check a single touchpoint, such as a visit, purchase or support case.
CSAT calculator
Enter how many people chose each answer on a 1–5 satisfaction question (for example, “How satisfied were you with your visit today?”).
CSAT = responses rated 4 or 5 ÷ all responses × 100. The average score is shown alongside, because the two can move differently.
satisfied (4–5) · 200 responses
- Satisfied 4–5 75%
- Neutral 3 12%
- Dissatisfied 1–2 13%
CSAT = (4s + 5s) ÷ total × 100(80 + 70) ÷ 200 × 100 = 75%
75% of respondents chose 4 or 5. CSAT runs from 0% to 100%: the share of satisfied customers, not an average grade. The 1–2 answers are the ones worth a personal follow-up. Targets differ by industry and touchpoint, so compare this number with your own previous periods and between locations that use the same question. With 200 responses, each single answer moves CSAT by up to 0.5 points.
What is CSAT?
CSAT stands for customer satisfaction score. It answers a narrow, practical question: how satisfied was this customer with this experience? The experience can be a branch visit, a delivery, a hotel stay, a support call or a single feature in your app.
Unlike Net Promoter Score, CSAT has no single inventor or trademarked method. It is a family of closely related practices that share three features: a direct satisfaction question, a short rating scale, and a result reported as the share of satisfied answers. That flexibility makes it the easiest customer metric to start with, and also the easiest to get inconsistent, so the definitions below matter.
CSAT is best understood next to the other two standard metrics:
- CSAT measures satisfaction with a moment.
- NPS measures loyalty to the whole relationship (“would you recommend us?”).
- CES measures how easy it was to get something done.
The three do not replace each other. A customer can be fully satisfied with today’s visit (high CSAT) and still not care enough about the brand to recommend it (passive on NPS). Our side-by-side guide NPS vs CSAT vs CES covers the differences in more depth.

How to calculate the CSAT score
The most common CSAT calculation is the “top-two-box” method on a 1–5 scale:
CSAT (%) = (number of 4 and 5 answers ÷ total number of answers) × 100
Worked example. A store collects 200 answers to “How satisfied were you with your visit today?”:
| Answer | Responses |
|---|---|
| 5 – Very satisfied | 70 |
| 4 – Satisfied | 80 |
| 3 – Neutral | 24 |
| 2 – Dissatisfied | 16 |
| 1 – Very dissatisfied | 10 |
Satisfied answers: 70 + 80 = 150. CSAT = 150 ÷ 200 × 100 = 75%. These are the default numbers in the calculator above; change them to check your own data, or use the standalone CSAT calculator.
The average score is a second, different number. Some teams report CSAT as the mean rating: (5×70 + 4×80 + 3×24 + 2×16 + 1×10) ÷ 200 = 784 ÷ 200 = 3.92 out of 5. Both are legitimate, but they behave differently. The top-two-box percentage ignores how unhappy the unhappy customers were; the average hides how many were unhappy. Pick one as your headline, report it consistently, and keep the 1–2 share visible next to it, because those are the customers worth a personal call.
Other scales work the same way. On a 1–3 or smiley scale, count the top answer (or top two on five smileys) as satisfied; on a 1–10 scale, many teams count 8–10. Whatever you choose, write it down and do not change it, or your trend line becomes meaningless.
One caution on comparisons: national satisfaction indexes such as the American Customer Satisfaction Index (ACSI) also report numbers on a 0–100 scale, but they come from a multi-question statistical model. They are not comparable with a simple top-two-box CSAT percentage.
CSAT survey questions: examples
A good CSAT question names the specific experience and uses neutral wording. Some examples by touchpoint:
- Visit or branch: “How satisfied were you with your visit today?”
- Purchase or checkout: “How satisfied are you with your purchase experience?”
- Customer service: “How satisfied were you with the help you received?”
- Delivery: “How satisfied are you with the delivery of your order?”
- Hotel or hospitality: “How satisfied were you with your stay?”
- Healthcare: “How satisfied were you with your appointment today?”
- Facilities: “How satisfied are you with the cleanliness of this washroom?”
- Digital: “How satisfied are you with the new booking page?”
Then add one open question so the score comes with a reason: “What is the main reason for your rating?” or, after a low score, “What should we have done differently?”. With conditional logic you can show the open question only to customers who chose 1–3, which keeps the survey short for everyone else.
If you want to understand why satisfaction moves, add two or three driver questions on the factors you can change, for example staff friendliness, waiting time and cleanliness, each on the same scale. Avoid double questions (“How satisfied were you with our speed and friendliness?”) and leading words (“How satisfied were you with our excellent service?”). For more examples by industry, see our list of customer feedback survey questions.
Choosing a CSAT scale: numbers, stars or smileys
The 1–5 scale is the most common, but the best scale depends on where you ask:
| Scale | Good for | Watch out for |
|---|---|---|
| 1–5 numbers or labels | Email, SMS and web surveys; easy to analyse | Label every point so “3” is understood the same way |
| Smileys (3 or 5 faces) | Kiosks, tablets and QR surveys in busy places; works across languages and ages | Fewer points means less nuance; decide how many faces count as “satisfied” |
| Stars | Digital products and post-purchase surveys | Customers associate stars with public reviews, which can inflate scores |
On a physical device, one tap is the whole survey for most people. A five-smiley question on a tablet at the exit can collect far more answers than an email sent the next day, simply because it asks at the right moment and costs the customer a second. The trade-off is less detail per response, which is why many teams combine an on-site smiley question with a longer online survey for customers who leave contact details.
When to measure CSAT
CSAT is a transactional metric: it works best immediately after a specific interaction, while the experience is fresh. Typical trigger points:
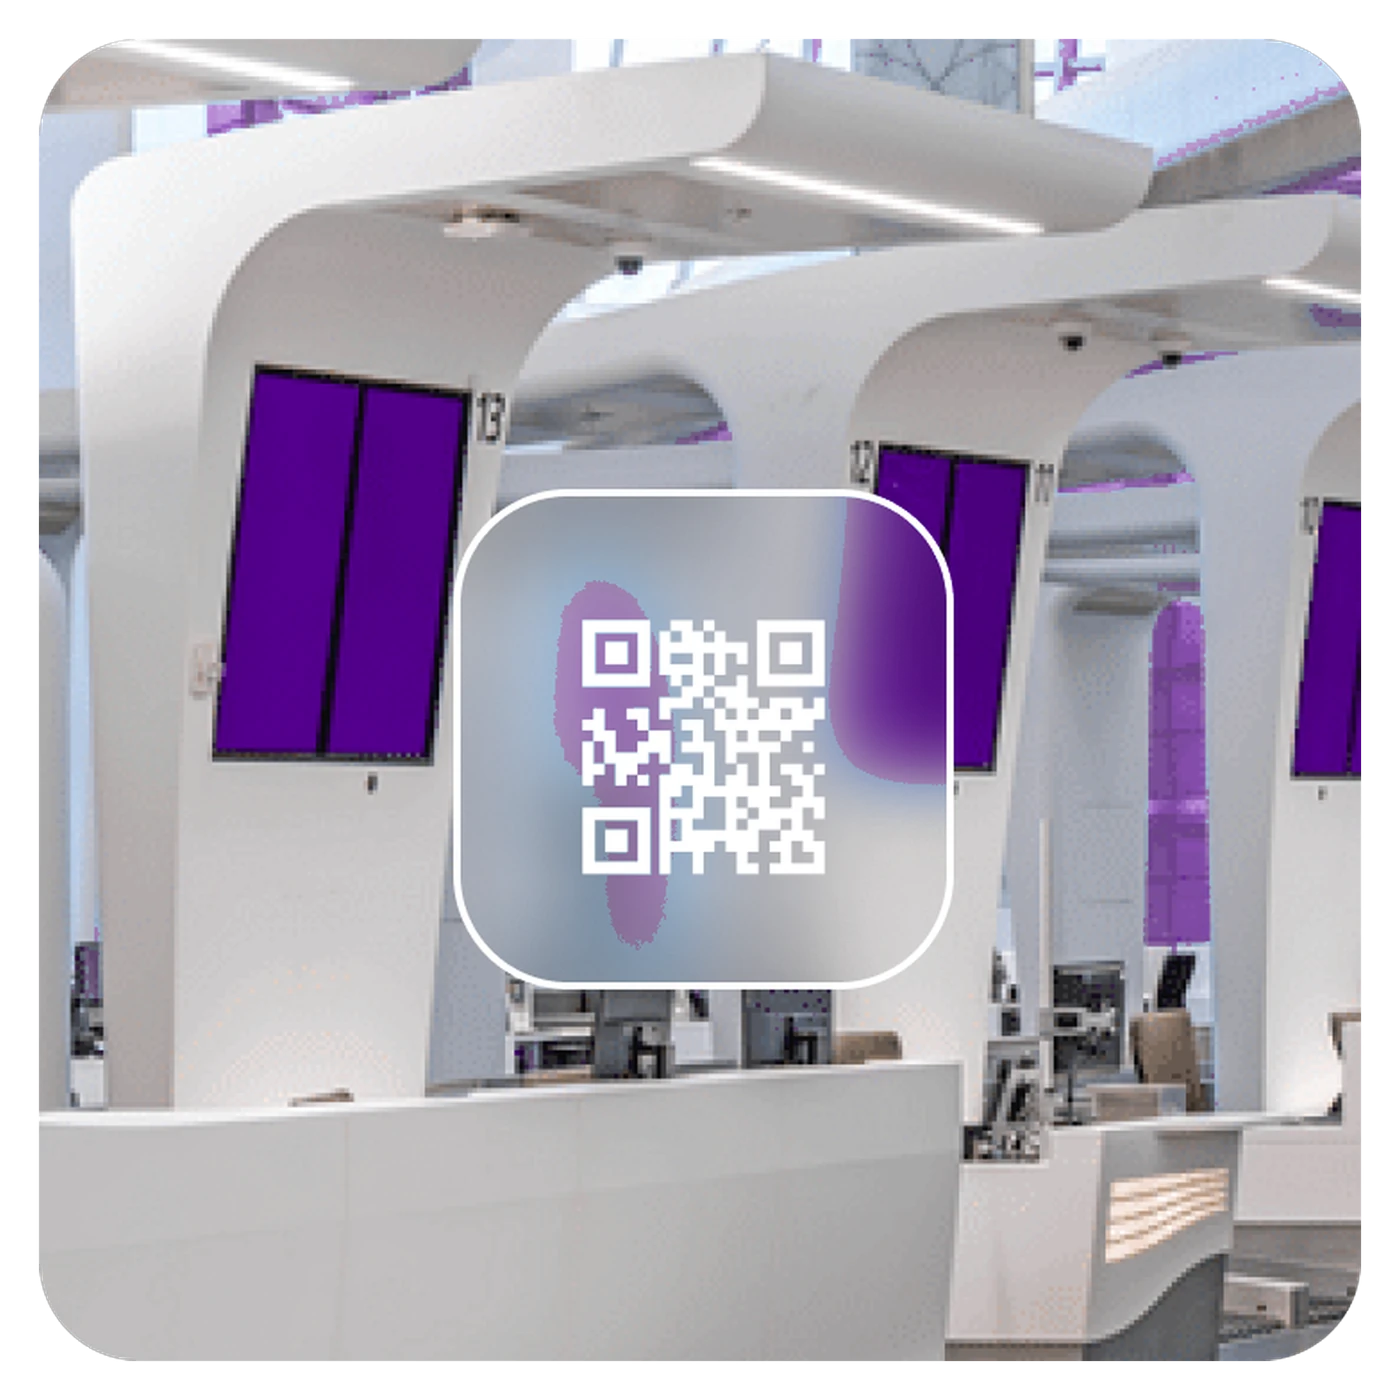
- at the exit of a store, branch, clinic or service hall (kiosk or QR code);
- after a support case is resolved (email or SMS);
- after delivery, installation or an appointment;
- at specific stations in a large venue, such as security, check-in or washrooms.
Use NPS rather than CSAT when you want a view of the whole relationship, for example a quarterly survey of your customer base. Use CES when the experience is a process the customer has to get through, such as a claim, a return or an account change. Many organisations use all three at different points, which is exactly what the NPS vs CSAT vs CES comparison describes.
Frequency matters as much as timing. CSAT at a single location with a few responses a day is noisy; read it weekly or monthly, and compare locations only when each has enough answers. With 50 responses, each answer moves CSAT by 2 percentage points.
From CSAT score to better service
A CSAT number only pays off when low scores trigger action. PwC’s 2018 “Experience is Everything” research found that almost a third of customers (32%) will leave a brand they love after a single bad experience, so the window for recovery is short.
- Alert on low scores in real time. A 1 or 2 should reach the location manager within minutes, not appear in a monthly report.
- Turn complaints into tracked cases. Give each one an owner, a deadline and a recorded root cause. See closed-loop feedback for the full process.
- Read comments by theme. Group open answers into topics (waiting time, staff, cleanliness, price) and fix the most frequent ones at the root.
- Compare like with like. Rank locations or teams on the same question and channel, and share the ranking with them; visibility itself drives improvement.
- Re-measure. After a fix, check whether CSAT for that touchpoint actually moved.
Measuring CSAT with Qmeter
Qmeter collects CSAT across every channel and calculates it live:
- Smiley, star and numeric ratings on kiosks and tablets (which keep working offline), QR codes, SMS and email campaigns, and web links or widgets.
- Real-time dashboard with CSAT and NPS side by side, filterable by location, service, channel and period.
- Automatic tickets from low ratings, with SLA deadlines and escalation, and an automatic satisfaction survey after each ticket is resolved.
- AI analysis of open comments for sentiment and recurring themes.
- Multilingual surveys so every customer can answer in their own language.
See the CSAT software page for details, or start a 14-day free trial.
Frequently asked questions
What does CSAT stand for?
CSAT stands for customer satisfaction score. It measures how satisfied customers are with a specific interaction, such as a visit, purchase or support case, usually with a single question on a 1–5 scale.
How is the CSAT score calculated?
Count the satisfied responses (4 and 5 on a 1–5 scale), divide by the total number of responses and multiply by 100. Example: 150 satisfied answers out of 200 give a CSAT of 75%.
What is a good CSAT score?
There is no universal standard: CSAT depends on the scale, the question, the touchpoint and the industry. The useful comparisons are your own score over time and between your locations or teams, measured with the same question and channel. Keep an eye on the share of 1 and 2 answers as well as the headline percentage.
What is the difference between CSAT and NPS?
CSAT measures satisfaction with a specific interaction and is asked right after it. NPS measures overall loyalty with the question “How likely are you to recommend us?” on a 0–10 scale. CSAT is transactional; NPS is usually relational. Many organisations use both.
What is a good CSAT survey question?
Name the specific experience and keep the wording neutral, for example “How satisfied were you with your visit today?” on a 1–5 scale, followed by one open question: “What is the main reason for your rating?”.
Should CSAT be a percentage or an average?
Both are used. The percentage of 4 and 5 answers is the most common headline and is easy to explain. The average rating (for example 3.92 out of 5) is more sensitive to how unhappy dissatisfied customers are. Choose one as your headline and report it consistently.
Measure it at every location — live in one day
Feedback kiosks, QR and web surveys, SMS and email, real-time alerts and follow-up tickets in one platform. 14-day free trial.
✓ 15 minutes · ✓ No commitment · ✓ A real CX person