Customer Effort Score (CES): Definition, Question and How to Calculate It
✓ Cloud or on-premise · ✓ Kiosk, QR, SMS, email and web · ✓ Live in one day
Customer Effort Score (CES) measures how easy it was for a customer to get something done: resolve an issue, return a product, book an appointment. The common CES 2.0 version asks how strongly customers agree that “the company made it easy for me to handle my issue” on a 1–7 scale; CES is the average score or the share answering 5–7.
CES calculator
Enter how many people chose each answer to “The company made it easy for me to handle my issue” on a 1–7 agreement scale.
CES (average) = sum of all scores ÷ number of responses. % agree = answers 5–7 ÷ all answers × 100.
average on a 1–7 scale · 75% found it easy · 120 responses
- Easy 5–7 75%
- Neutral 4 10%
- Difficult 1–3 15%
CES = sum of scores ÷ responses622 ÷ 120 = 5.18
% agree = answers 5–7 ÷ total × 10090 ÷ 120 × 100 = 75%
Higher means easier. On this agreement scale 7 is the best possible average and 4 is the neutral midpoint, so an average above 4 means more customers agreed than disagreed that you made things easy. Effort depends heavily on the process you measure (a refund is not a password reset), so compare CES for the same touchpoint over time rather than against other companies. Read the 1–3 answers first: they point at the steps that cost customers the most effort.
What is Customer Effort Score?
Customer Effort Score is a transactional metric for processes. Where CSAT asks how satisfied someone was and NPS asks whether they would recommend you, CES asks a more operational question: how much effort did this cost the customer?
The idea comes from researchers at CEB (now part of Gartner). Matthew Dixon, Karen Freeman and Nicholas Toman popularised it in the Harvard Business Review article “Stop Trying to Delight Your Customers” (2010). Their central argument: in customer service, loyalty is driven less by exceeding expectations and more by how little effort customers have to spend to get their problem solved. Repeating information, being transferred between departments and having to call back are the experiences that push people away.
The first version asked “How much effort did you personally have to put forth to handle your request?” on a 1–5 scale, where a high number meant more effort. Because that reversed direction confused respondents and readers of reports, a revised version, usually called CES 2.0 and described in the authors’ later book “The Effortless Experience” (2013), replaced it with an agreement statement on a 1–7 scale, where higher is better. That is the form most organisations use today.
The CES question and scale
The CES 2.0 statement is:
“[Company] made it easy for me to handle my issue.”
Customers answer on a seven-point agreement scale:
| Score | Answer |
|---|---|
| 7 | Strongly agree |
| 6 | Agree |
| 5 | Somewhat agree |
| 4 | Neither agree nor disagree |
| 3 | Somewhat disagree |
| 2 | Disagree |
| 1 | Strongly disagree |
Adapt “handle my issue” to the process you are measuring, and keep the wording fixed afterwards:
- “It was easy to get my question answered today.”
- “Returning my order was easy.”
- “Booking my appointment was easy.”
- “It was easy to complete my application at this service centre.”
- “Finding what I needed on the website was easy.”
Simpler variants exist: a 1–5 “very difficult” to “very easy” scale, or three or five faces on a kiosk. They are fine as long as you use one version consistently and do not compare results across versions.
Always add one open question, ideally only for low scores: “What made this difficult?” The answers usually point straight at the step to fix.
How to calculate CES
There are three common ways to turn CES answers into a number. Use whichever your team understands best, then stick to it.
Worked example: 120 customers answer after a support case:
| Score | 7 | 6 | 5 | 4 | 3 | 2 | 1 |
|---|---|---|---|---|---|---|---|
| Responses | 24 | 36 | 30 | 12 | 8 | 6 | 4 |
- Average CES = sum of all scores ÷ number of responses. (7×24 + 6×36 + 5×30 + 4×12 + 3×8 + 2×6 + 1×4) ÷ 120 = 622 ÷ 120 = 5.18 out of 7.
- % agree (easy) = answers 5–7 ÷ all answers × 100. (24 + 36 + 30) ÷ 120 = 90 ÷ 120 = 75%.
- Net easy = % agree − % disagree. Answers 1–3 are 18 of 120, or 15%, so 75 − 15 = 60.
These are the default numbers in the calculator above. Change them to your own counts, or use the standalone CES calculator.
The average is the most common headline; the percentage is easier to explain to a frontline team (“three in four customers found it easy”). Whichever you report, keep the share of 1–3 answers visible, because a stable average can hide a growing group of customers who struggled.
What is a good CES score?
On the 1–7 agreement scale, 4 is the neutral midpoint, so an average above 4 means more customers agreed than disagreed that the process was easy. Beyond that, there is no meaningful universal benchmark. Effort depends almost entirely on the process: resetting a password and settling an insurance claim will never score the same, and comparing them, or comparing your claims process with another company’s password reset, tells you nothing.
Useful comparisons are internal:
- The same process over time, before and after a change.
- The same process across channels: is the return easier in store or online?
- The same process across locations or teams, with enough responses per group.
Read the distribution, not just the average. A rising share of 1–3 answers is an early warning even when the average barely moves.
When to use CES (and when not to)
CES works best immediately after a task the customer had to complete:
- after a support ticket, call or chat is closed;
- after a return, exchange, refund or claim;
- after onboarding, account opening or an application at a service centre;
- after self-service actions: booking, rescheduling, paying a bill.
It is less useful for experiences that are not tasks (a hotel stay, a meal, a museum visit), where CSAT fits better, and it says little about the overall relationship, which is the job of NPS. The three metrics are complementary; the comparison NPS vs CSAT vs CES shows how to combine them.
CES is also a strong process-improvement tool because the fixes are usually concrete: fewer transfers, fewer forms, clearer instructions, a callback instead of a queue. When the open comments name the same step again and again, that step is your next project.
Running a CES survey: practical tips
- Ask within minutes or hours, not days. Effort is forgotten quickly. Trigger the survey by SMS or email when the ticket closes, or show it on a tablet at the service desk.
- Keep it to two questions: the CES statement and “What made this difficult?” (shown for 1–3). Add one driver question only if you will act on it.
- Measure one process per survey. “Was it easy?” only makes sense when the customer knows exactly what “it” is.
- Segment by channel and reason. A CES for “all contacts” blends easy and hard requests; split by contact reason to see where effort really sits.
- Act on low scores fast. A customer who strongly disagrees that it was easy may not have had the issue solved at all. Route those answers to a team member for a follow-up, as in closed-loop feedback.
The business case is the same as for any loyalty metric: PwC’s 2018 “Experience is Everything” research found that almost a third of customers (32%) will walk away from a brand they love after one bad experience, and needless effort is one of the most common ways an experience turns bad.
Measuring CES with Qmeter
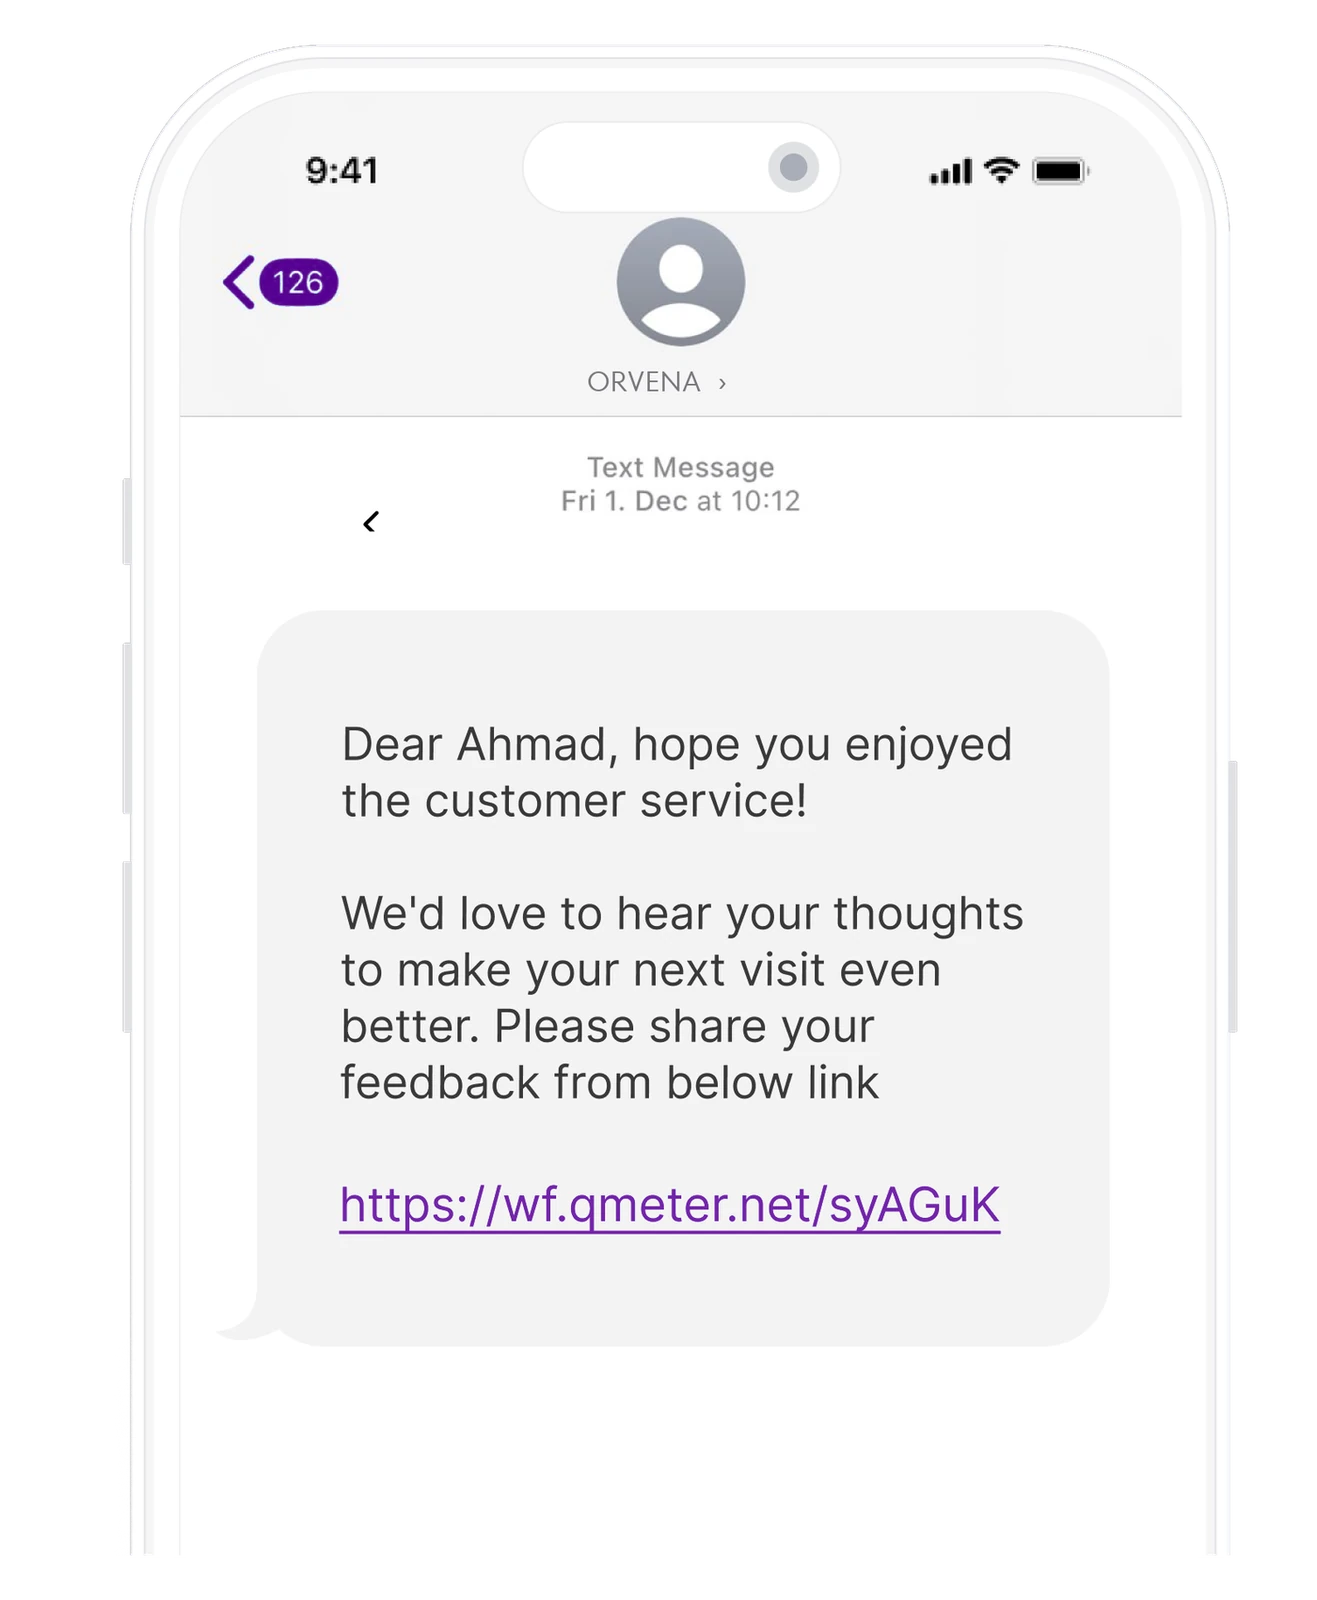
Qmeter does not lock you into one CES format. You build the CES question in the survey builder as a 1–7 single-choice question (or a smiley rating on kiosks), add a conditional “What made this difficult?” question for low scores, and send it through any channel:
- SMS and email campaigns after a case or appointment, QR codes at service points, kiosks and tablets at the desk (online or offline) and web links or widgets after self-service tasks.
- Ticket generation rules that turn low ratings into follow-up cases with an owner and SLA.
- Reports and AI analysis of open comments, so you can see which steps generate the most effort, by location, service and channel.
Qmeter’s own tickets also send an automatic satisfaction survey after resolution, so you can see how customers rate the way complaints were handled. Start a 14-day free trial, or read about ticketing and SLAs.
Frequently asked questions
What is Customer Effort Score?
Customer Effort Score (CES) measures how easy it was for a customer to complete a task such as resolving an issue, returning a product or booking an appointment. The common version asks how strongly the customer agrees that the company made it easy to handle their issue, on a 1–7 scale.
How do you calculate CES?
The most common method is the average: add up all scores and divide by the number of responses. Example: 622 points from 120 responses give a CES of 5.18 out of 7. Alternatively, report the percentage of customers who answered 5–7 (agree), or that percentage minus the share who answered 1–3.
What is the CES 2.0 question?
CES 2.0 uses the statement “The company made it easy for me to handle my issue”, answered on a seven-point scale from 1 (strongly disagree) to 7 (strongly agree). It replaced the original 1–5 effort question, where a higher number meant more effort.
What is a good Customer Effort Score?
On the 1–7 agreement scale, an average above 4 means more customers found the process easy than difficult. There is no meaningful universal benchmark because effort depends on the process measured; compare the same process over time, across channels and between your own locations.
When should you use CES instead of CSAT or NPS?
Use CES right after a task the customer had to complete, such as a support case, return, claim or application. Use CSAT for satisfaction with an experience such as a visit or stay, and NPS for loyalty to the overall relationship.
Who created the Customer Effort Score?
CES was developed by researchers at CEB, now part of Gartner, and popularised by Matthew Dixon, Karen Freeman and Nicholas Toman in the 2010 Harvard Business Review article “Stop Trying to Delight Your Customers”. The later CES 2.0 version is described in the book “The Effortless Experience” (2013).
Measure it at every location — live in one day
Feedback kiosks, QR and web surveys, SMS and email, real-time alerts and follow-up tickets in one platform. 14-day free trial.
✓ 15 minutes · ✓ No commitment · ✓ A real CX person