What Is Net Promoter Score (NPS)? How to Calculate It and Use It
✓ Cloud or on-premise · ✓ Kiosk, QR, SMS, email and web · ✓ Live in one day
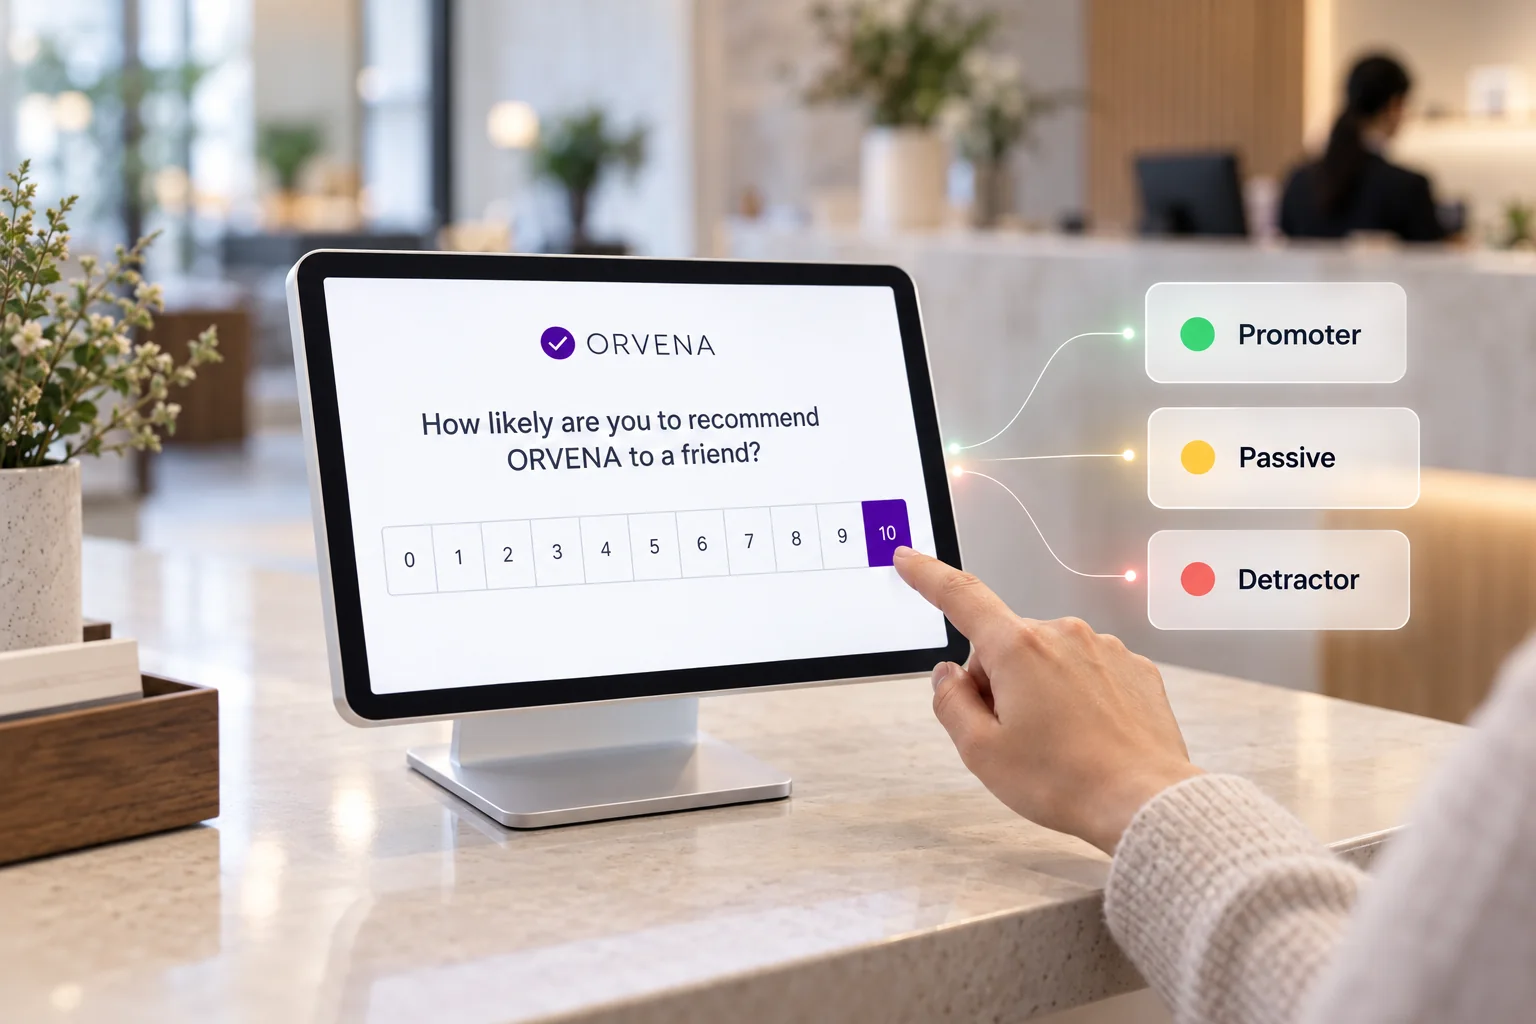
Net Promoter Score (NPS) measures customer loyalty with one question: “How likely are you to recommend us to a friend or colleague?”, answered from 0 to 10. NPS is the percentage of promoters (9–10) minus the percentage of detractors (0–6), giving a score from −100 to +100. Try the calculator below, then read how to run NPS properly.
Net Promoter Score calculator
Enter how many people chose each group on the 0–10 question, or paste the raw answers.
NPS = % promoters (9–10) − % detractors (0–6). Passives (7–8) count in the total but not in the subtraction.
on a scale from −100 to +100 · 200 responses
- Promoters 45%
- Passives 35%
- Detractors 20%
NPS = % promoters − % detractors45% promoters − 20% detractors = NPS 25
(90 − 40) ÷ 200 × 100 = 25
Positive score: the respondents who would recommend you outnumber those who would not. The scale runs from −100 (everyone a detractor) to +100 (everyone a promoter). Published benchmarks vary widely by industry, country and survey channel, so the most reliable comparison is your own NPS over time, measured the same way. With 200 responses, one detractor becoming a promoter moves the score by 1 point.
What is Net Promoter Score?
Net Promoter Score is a loyalty metric built on a single recommendation question. Customers answer on an 11-point scale from 0 (“not at all likely”) to 10 (“extremely likely”), and the answers are condensed into one number between −100 and +100.
The method was introduced by Fred Reichheld of Bain & Company in the Harvard Business Review article “The One Number You Need to Grow” (December 2003). The reasoning behind it is simple: recommending a company puts your own reputation on the line, so willingness to recommend is a stricter signal of loyalty than a general “are you satisfied?” question, which many people answer politely.
Three things are worth getting right from the start:
- NPS is a score, not a percentage. An NPS of 40 does not mean “40% of customers are happy”. It means the share of promoters is 40 percentage points higher than the share of detractors.
- NPS measures the relationship, not a single moment. Satisfaction with one interaction is better captured by CSAT, and the ease of getting something done by the Customer Effort Score. Our comparison of NPS vs CSAT vs CES shows where each one fits.
- NPS is a process, not just a number. Used well, it is a loop: ask, understand the reasons, act on every critical answer, and check whether the score moves.
Why bother? Because loyalty shows up in the profit and loss account. Bain & Company research published in the Harvard Business Review found that a 5% increase in customer retention can raise profits by 25% to 95%. NPS is the most widely used early-warning signal for whether that retention is growing or eroding. Its popularity is also a practical advantage: board members, store managers and new hires usually already understand the logic, so nobody has to learn a home-grown index.
Net Promoter®, NPS® and Net Promoter Score® are registered trademarks of Bain & Company, Inc., Satmetrix Systems, Inc. and Fred Reichheld.
The NPS question: wording and follow-up
The standard NPS question is:
“On a scale from 0 to 10, how likely are you to recommend [company] to a friend or colleague?”
Label the ends of the scale (0 = “not at all likely”, 10 = “extremely likely”) and leave the middle numbers unlabelled. You can adapt the object of the recommendation to the context, as long as you keep the wording identical over time:
- Company level: “How likely are you to recommend [company] to a friend or colleague?”
- Location or service: “How likely are you to recommend this branch / this clinic / our support team?”
- B2B: “How likely are you to recommend [company] to a peer in your industry?”
The score tells you what customers think; it never tells you why. Always add exactly one open follow-up question, for example “What is the main reason for your score?” or, for passives, “What would it take for you to give us a 10?”. Those comments are the material you will actually work with. In most survey tools you can show a different follow-up to each group with conditional logic.
Avoid three common distortions: changing the scale (1–10 or 1–5 is no longer NPS and breaks comparability), leading wording (“How likely are you to recommend our award-winning service?”), and asking straight after a moment you know went badly only for some customers, which skews the sample.
How to calculate NPS: formula and worked example
Calculating NPS takes three steps.
- Sort every answer into a group.
| Group | Score | What it usually means |
|---|---|---|
| Promoters | 9–10 | Loyal enthusiasts who are likely to recommend you |
| Passives | 7–8 | Satisfied but unenthusiastic; open to a better offer |
| Detractors | 0–6 | Unhappy customers who may leave or warn others |
- Work out each group’s share of all responses (passives included in the total).
- Subtract the detractor share from the promoter share.
NPS = % promoters − % detractors
Worked example. You collect 200 responses: 90 promoters (45%), 70 passives (35%) and 40 detractors (20%). Your NPS is 45 − 20 = 25. Passives do not appear in the subtraction, but because they count in the total they pull both shares down. You can check this example in the calculator above, or use the standalone Net Promoter Score calculator with your own numbers or raw 0–10 answers.
In a spreadsheet, with the scores in column B (rows 2–201):
- Promoters:
=COUNTIF(B2:B201,">=9") - Detractors:
=COUNTIF(B2:B201,"<=6") - NPS:
=(promoters − detractors) / COUNT(B2:B201) * 100
Three mistakes appear again and again:
- Reporting NPS as a percentage. Write “NPS 25”, not “25%”.
- Counting 7s and 8s as promoters. They are passives, even if they feel like good scores.
- Using the average score. An average of 7.5 can produce very different NPS values depending on how the answers are spread. The whole point of NPS is to show that spread.
Promoters, passives and detractors: what each group needs
The real value of NPS is not the number but the three groups, because each calls for a different response.
Promoters (9–10) are your growth engine. Thank them, and use the moment: right after a 9 or 10 is the best time to ask for a public review or a referral. That window closes within days.
Passives (7–8) are the most underrated group. They are not unhappy, just not attached, and many leave quietly when a better offer appears. Ask them what was missing; their answers are often the most concrete improvement ideas in the whole data set.
Detractors (0–6) are urgent. PwC’s 2018 “Experience is Everything” research found that almost a third of customers (32%) will walk away from a brand they love after a single bad experience. A detractor whose problem is solved quickly and personally, on the other hand, often becomes one of your most loyal customers. That only works if a low score reaches the right person straight away rather than sitting in a monthly report.
What is a good NPS score?
The only threshold that holds everywhere is mathematical: an NPS above 0 means you have more promoters than detractors. Beyond that, be careful with any single “good score” you read online. There is no universal standard, and published benchmarks differ by industry, country, channel and the provider that compiled them.
Several factors move NPS regardless of how good your service is:
- Industry structure. Contract lock-in, price-driven purchases and infrequent contact, often only when something has gone wrong, make high scores harder. Frequent, voluntary, experience-led purchases make them easier.
- Culture. Rating habits differ between countries. In some markets top marks are given sparingly and an 8 is a sincere compliment; NPS still counts it as passive. Compare markets separately.
- Channel and timing. A kiosk at the exit, an email a week later and an annual relationship survey reach different people at different moments, so they produce systematically different scores.
- Sample size. NPS is the difference between two shares, so it swings a lot when responses are few.
The sample-size effect is easy to quantify. When one detractor becomes a promoter, the score moves by 200 ÷ number of responses:
| Responses | One detractor → promoter moves NPS by |
|---|---|
| 20 | 10 points |
| 50 | 4 points |
| 100 | 2 points |
| 400 | 0.5 points |
So with a few dozen responses a month, compare quarters, not months. The most reliable benchmark is your own trend: the same question, the same channel and the same audience, measured over time and compared between your own locations or teams. Direct competitors measured the same way are the only external comparison worth much.
Transactional vs relational NPS
There are two ways to use the NPS question, and mixing them produces a number nobody can interpret.
| Transactional NPS | Relational NPS | |
|---|---|---|
| When | Right after a specific interaction: a visit, purchase, delivery or support case | At fixed intervals, independent of any interaction (for example quarterly) |
| Measures | How that touchpoint affected willingness to recommend | The overall health of the relationship |
| Best for | Frontline teams, locations, processes | Leadership, strategy, account management |
| Typical channel | Kiosk, QR code, SMS or email triggered by the event | Email campaign to the customer base |
Most organisations need both: relational NPS as the compass, transactional NPS to find which touchpoints help or hurt. Report them separately. More on the event-triggered approach in our guide to transactional feedback.
How to run an NPS survey
How you ask influences the result as much as what customers experienced. Four decisions matter most.
1. Timing. Ask transactional NPS as close to the moment as possible: the end of a visit, delivery day, the hour after a support case is resolved. Run relational NPS on a fixed calendar so trends are comparable. An annual survey on its own shows problems only after customers have gone.
2. Channel. Reach people where the experience happens:
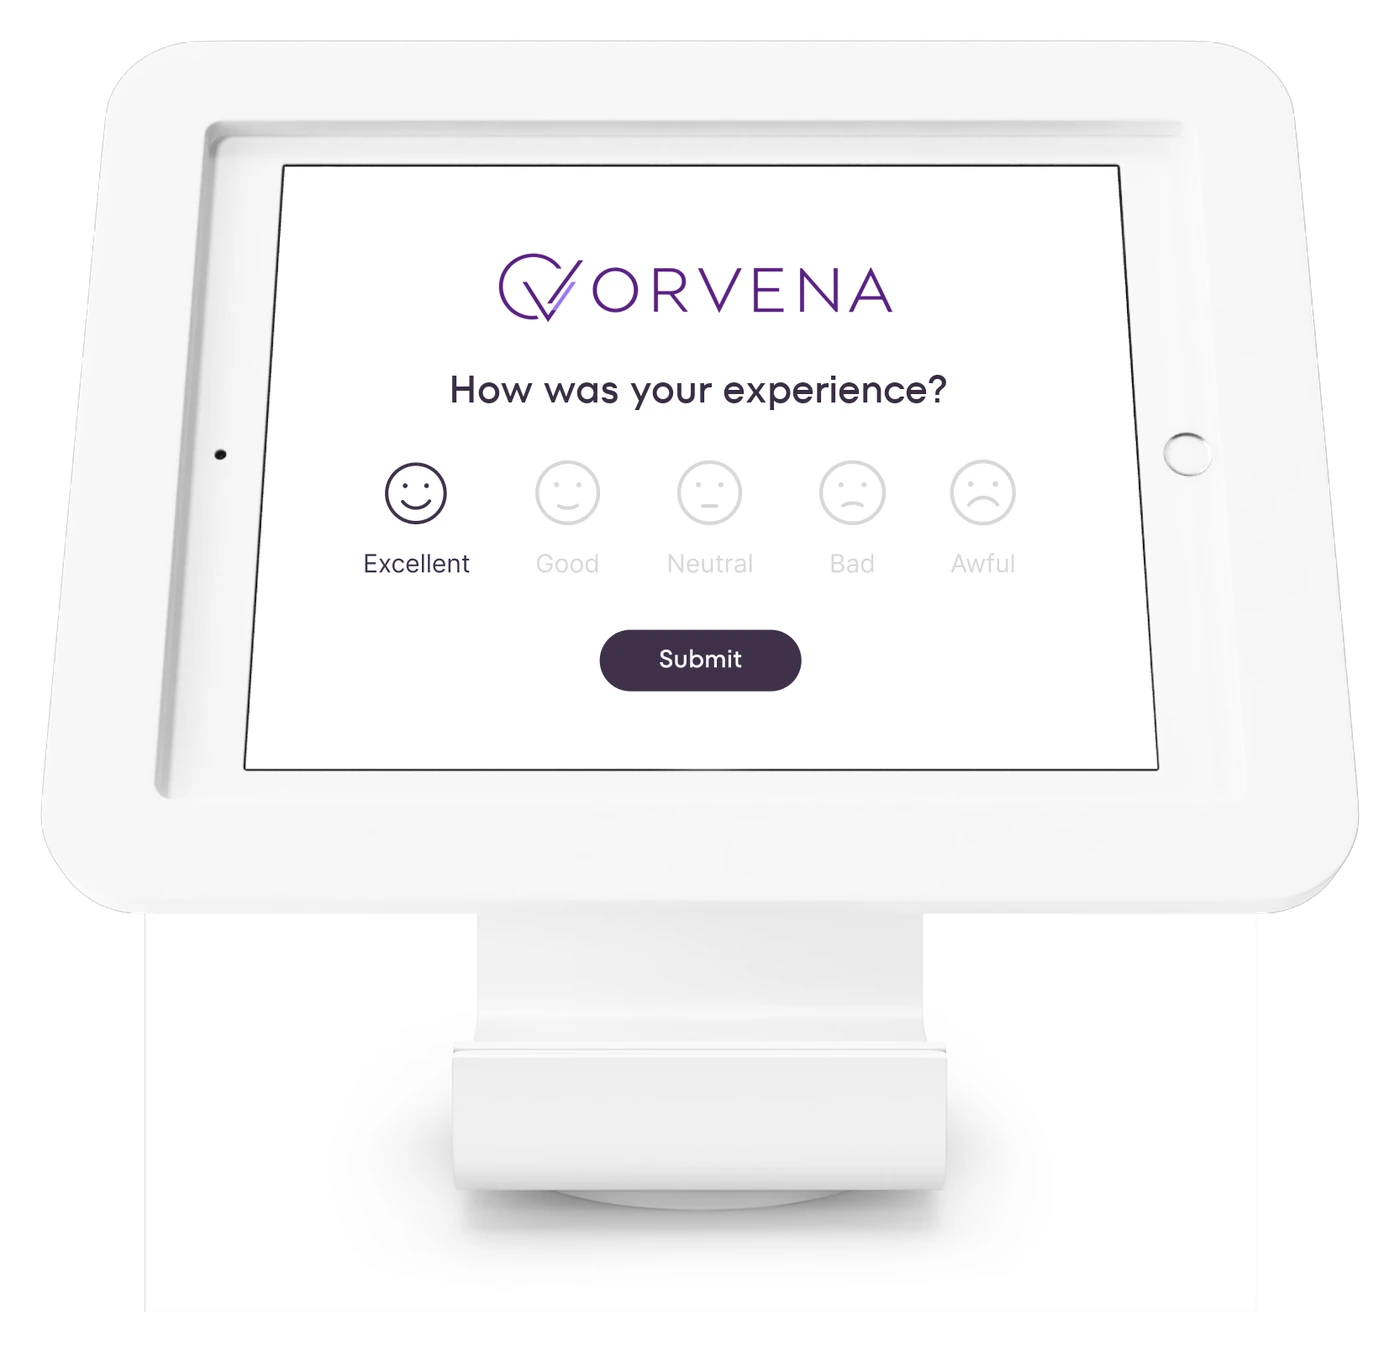
- Kiosk or tablet at the exit, counter or gate. Good for physical locations and walk-in customers who never leave contact details. A feedback kiosk can keep collecting when the connection drops and upload later.
- QR code on receipts, tables, rooms or waiting areas, opening the survey on the customer’s own phone. See QR code feedback.
- SMS and email after a delivery, appointment or support case, when you already have the contact.
- Web link or widget inside your site, app or customer portal.
Channels reach different customers, so compare each channel with itself over time rather than against the others.
3. Length and language. Keep it short: the NPS question, one open follow-up, and at most a couple of driver questions. Offer the survey in the languages your customers actually speak; a question in the wrong language mostly measures who could read it.
4. Privacy. Tell people how their answers are used, collect only the personal data you need, and decide up front whether answers will be followed up personally (which requires contact details and consent) or kept anonymous.
Closing the loop: from score to action
An NPS programme that only measures changes nothing. What separates rising scores from flat ones is usually what happens in the 48 hours after an answer comes in. Work on two loops.
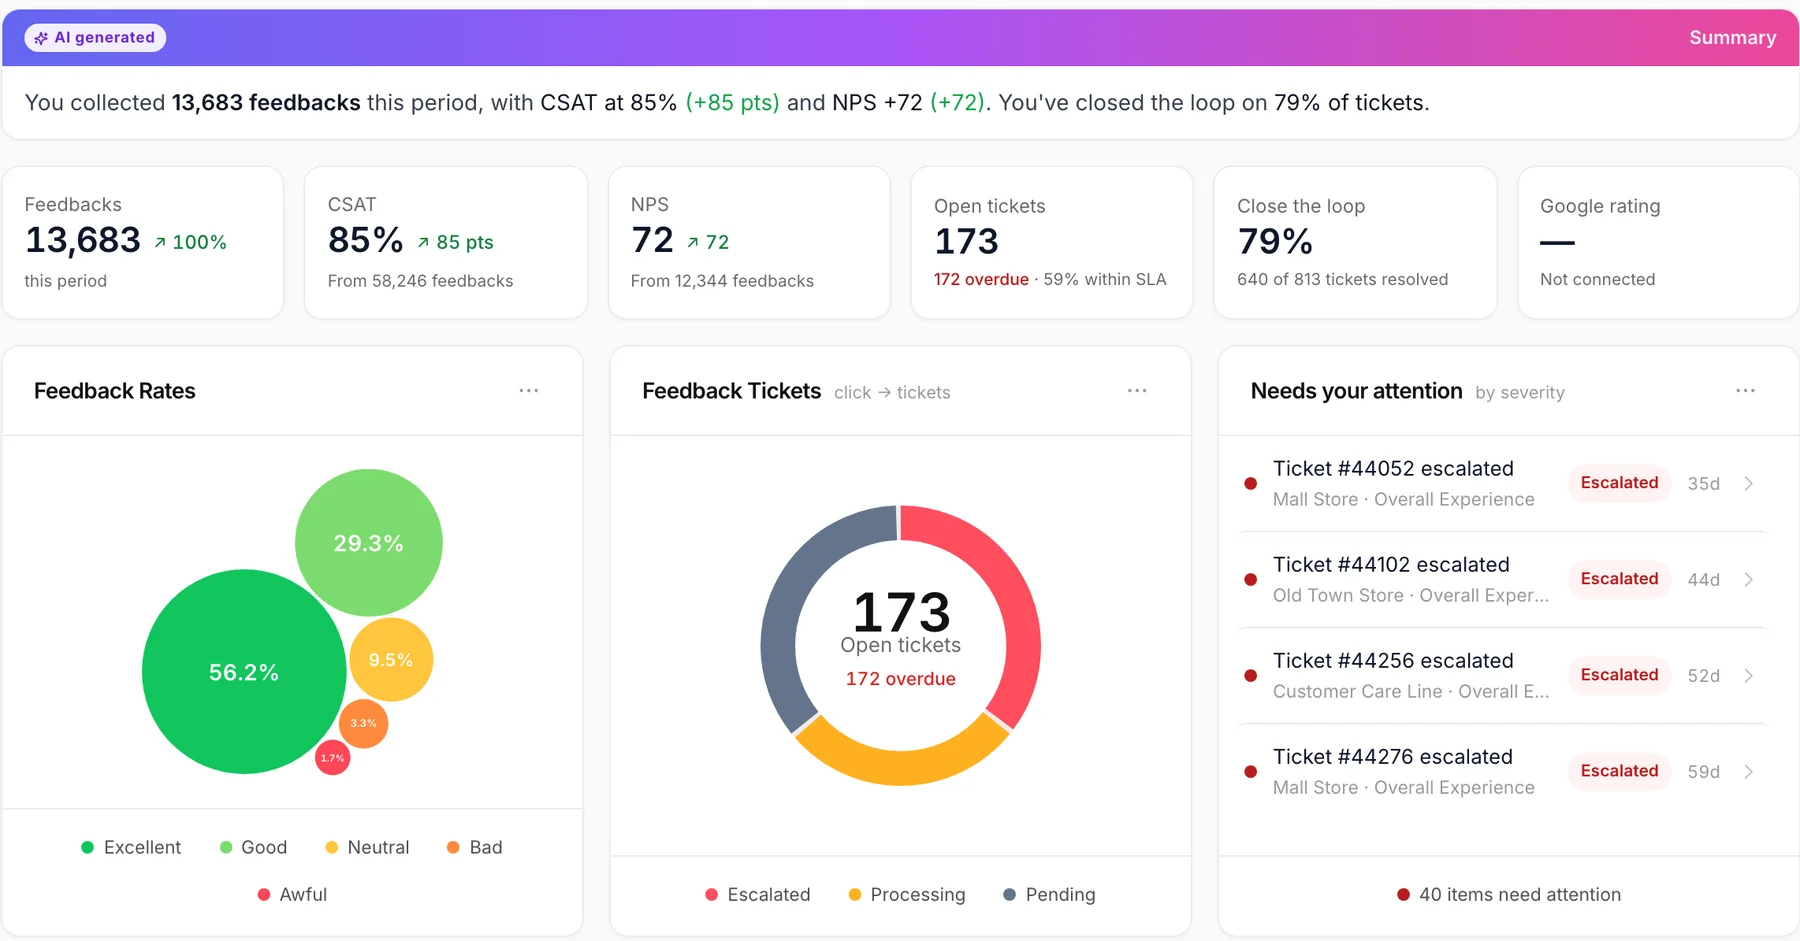
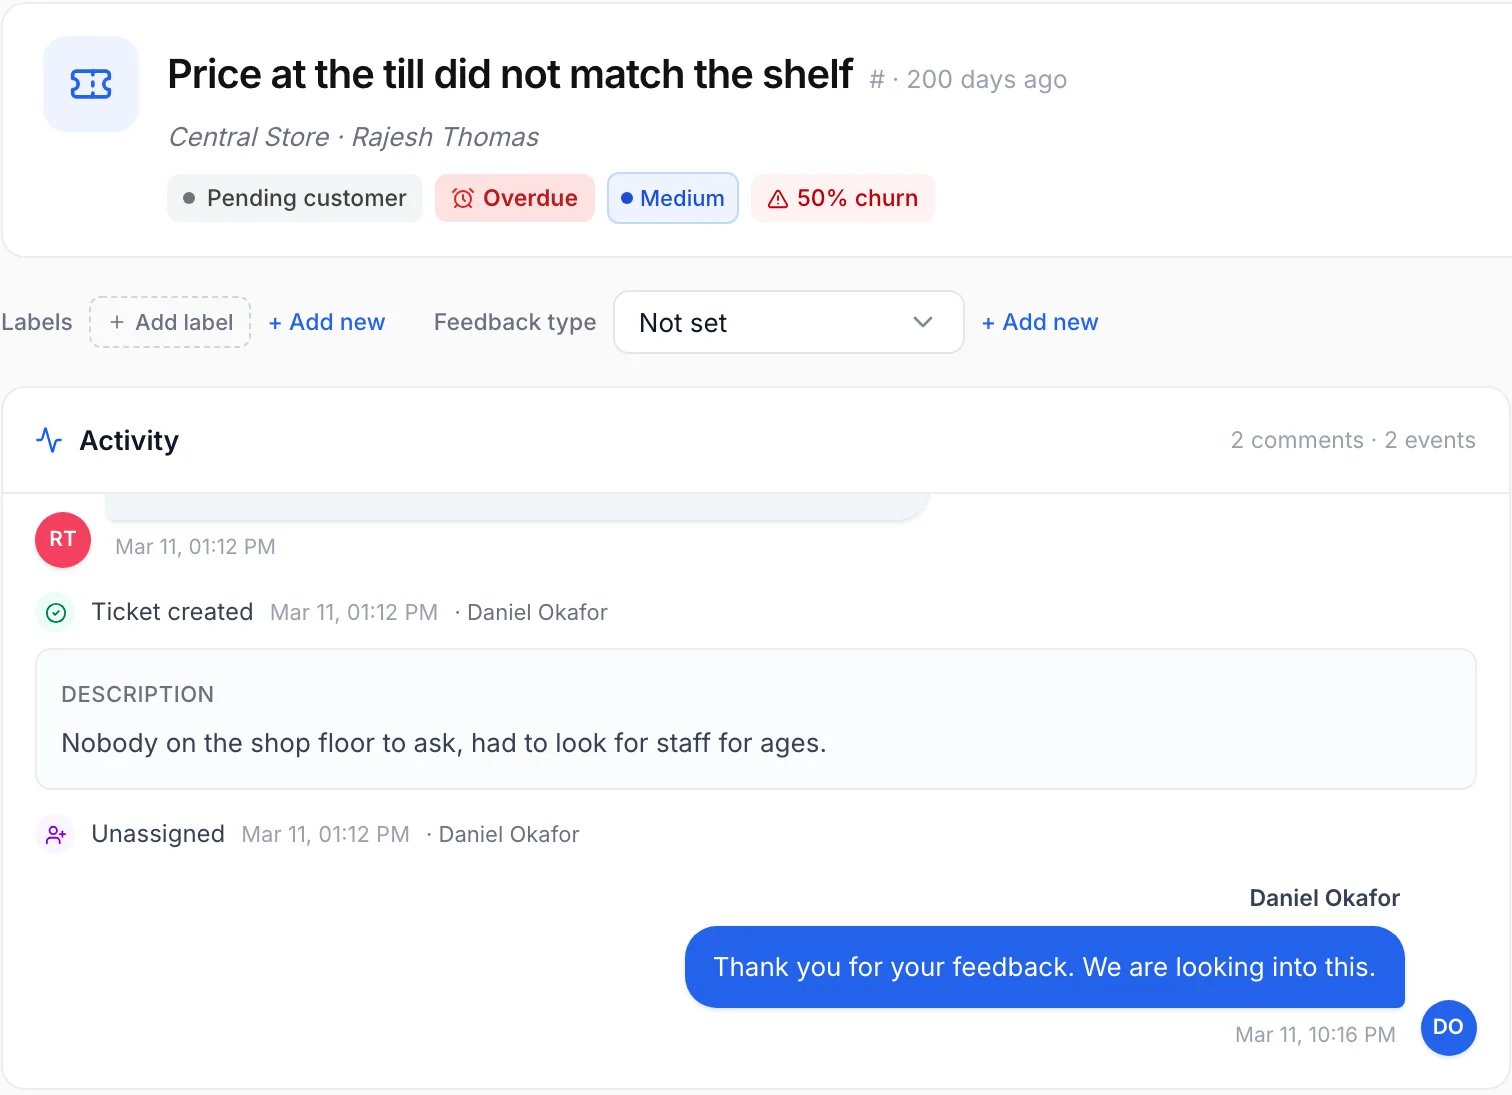
The inner loop: every detractor becomes a case. A 0–6 is an open issue, not a data point. Route it to an owner with a response deadline and record how it was resolved, exactly like a support ticket. Teams that work this way win back some detractors before they leave or post a public review; everyone else learns about the problem from next quarter’s report. Our guide to closed-loop feedback walks through the set-up.
The outer loop: patterns become fixes. When the same theme keeps appearing in comments (waiting time, reachability, one step in a process), prioritise it and fix the cause rather than apologising case by case. This is where the open follow-up question pays off: it turns a score into a ranked list of topics.
Three accelerators:
- Manage response time, not the score. “How fast do we respond to critical feedback?” is controllable and hard to game; the score follows.
- Make results visible. A dashboard every location can see creates more movement than a monthly slide deck.
- Activate promoters. Invite 9s and 10s to leave a public review while the experience is fresh.
Limitations of NPS
NPS is the most widely used loyalty metric and also one of the most criticised. The objections are fair and worth knowing:
- One question gives no causes. Without the follow-up comment, you know something changed but not why.
- Intention is not behaviour. NPS records stated willingness to recommend, not actual recommendations or repurchases.
- Cultural and channel bias. The same service scores differently across countries and channels.
- Easy to game. Once bonuses depend on NPS, staff have an incentive to ask for 10s or to avoid surveying unhappy customers.
- Statistical noise. Small samples make month-to-month changes mostly noise.
None of these is a reason to drop NPS; they are reasons not to use it naively. Treat it as a thermometer, not a diagnosis, and pair it with CSAT for individual touchpoints and CES for processes. If you want one index that combines all rating types across channels, Qmeter also reports an SLI score.
Measuring NPS automatically with Qmeter
Everything above — multi-channel collection, a follow-up question, fast reaction to detractors, clean reporting by location — is hard to sustain in spreadsheets. Qmeter runs the whole loop:
- One survey, every channel: kiosk and tablet (online and offline), QR code, SMS and email campaigns, web link and widget, all feeding the same real-time dashboard.
- NPS built in: a native 0–10 NPS question with conditional follow-ups, calculated live per location, channel, service and period.
- Detractors become tickets: generation rules turn low scores into tickets with an owner, priority and SLA, with escalation if nobody responds.
- AI analysis of comments: sentiment and themes from open answers, so the reasons behind the score are visible without reading every line.
- Multilingual surveys and an on-premise option for organisations that need it.
You can try it with a 14-day free trial, or see the product overview on the NPS software page.
Frequently asked questions
What is Net Promoter Score in simple terms?
Net Promoter Score (NPS) measures how likely customers are to recommend a company, on a scale from 0 to 10. People who answer 9 or 10 are promoters, 7 or 8 passives, and 0 to 6 detractors. NPS is the percentage of promoters minus the percentage of detractors, so it ranges from −100 to +100.
How do you calculate NPS?
Divide the number of promoters (9–10) by the total number of responses to get the promoter percentage, do the same for detractors (0–6), then subtract the detractor percentage from the promoter percentage. Example: 200 responses with 90 promoters (45%) and 40 detractors (20%) give an NPS of 25.
What is the NPS question?
The standard wording is: “On a scale from 0 to 10, how likely are you to recommend [company] to a friend or colleague?”, with 0 labelled “not at all likely” and 10 “extremely likely”. Follow it with one open question such as “What is the main reason for your score?”.
What is a good NPS score?
Any score above 0 means you have more promoters than detractors. Beyond that there is no universal standard: published benchmarks vary widely by industry, country and survey channel. The most reliable comparison is your own NPS over time, measured with the same question, channel and audience, and compared between your own locations or teams.
Is NPS a percentage?
No. NPS is the difference between two percentages, expressed as a number from −100 to +100. An NPS of 30 means the share of promoters is 30 percentage points higher than the share of detractors, not that 30% of customers are satisfied.
Why are 7 and 8 not counted as promoters?
The NPS method treats 7 and 8 as passive: satisfied but not enthusiastic enough to recommend actively. They are included in the total number of responses, which lowers both the promoter and detractor percentages, but they do not appear in the subtraction itself.
How often should you measure NPS?
Measure transactional NPS continuously, right after key interactions such as a visit, delivery or support case, and relational NPS at fixed intervals, for example quarterly. With small monthly samples, compare quarters rather than months so random swings are not mistaken for trends.
Measure it at every location — live in one day
Feedback kiosks, QR and web surveys, SMS and email, real-time alerts and follow-up tickets in one platform. 14-day free trial.
✓ 15 minutes · ✓ No commitment · ✓ A real CX person