Customer effort score (CES) survey template
✓ Cloud or on-premise · ✓ Kiosk, QR, SMS, email and web · ✓ Live in one day
A customer effort score survey template asks customers to rate the statement “[Company] made it easy for me to handle my request” on a 1–7 scale from strongly disagree to strongly agree, then asks where the effort came from. Send it right after a task: a support contact, an application, a return or a payment.
The customer effort score survey template
Customer effort score was introduced by researchers at CEB (now part of Gartner) in the 2010 Harvard Business Review article “Stop Trying to Delight Your Customers”. Their argument: in service interactions, reducing effort does more for loyalty than exceeding expectations. CES is therefore the right metric wherever customers come to get something done — resolve a problem, submit a document, return a product, renew a licence.
The template uses the agreement-statement form of the question, which is the most widely used today. Its main advantage over “How much effort did you have to put in?” is that a high number means a good result, like every other score on your dashboard.
Full version (QR code, email, SMS link or web) — 8 questions
- [Company] made it easy for me to handle my request today.
Answer type: 1–7 agreement scale (Strongly disagree → Strongly agree), required
The CES question. Label the ends and the middle (4 = Neither agree nor disagree). - What did you come to do today?
Answer type: Single choice, e.g. Report a problem · Make a payment · Submit or collect documents · Return or exchange · Get information · Other
Effort depends heavily on the task; this lets you compare like with like. - How many times have you contacted us about this request?
Answer type: Single choice: This is the first time · 2 times · 3 or more times
Repeat contacts are the clearest sign of effort — and the most expensive one for you. - Was your request fully resolved?
Answer type: Single choice: Yes · Partly · No - What made it harder than it should have been? (shown for 1–4)
Answer type: Multiple choice: Waiting or queue · Being transferred · Repeating information · Unclear instructions · Missing documents or requirements · Opening hours · Other - How long did the whole process take, from start to finish?
Answer type: Single choice: Under 10 min · 10–30 min · 30–60 min · Over an hour - If you could change one step, which one would it be?
Answer type: Open text, optional - May we contact you about your experience?
Answer type: Yes / No + phone or email on Yes
Short version for a kiosk or tablet (3 questions)
On a kiosk, the 7-point agreement scale is still usable as large numbered buttons. Keep the friction question and a callback option:
- It was easy to get what I came for today.
Answer type: 1–7 agreement scale, required - What made it harder? (shown for 1–4)
Answer type: Multiple choice: Waiting · Transfers · Repeating information · Unclear steps · Other - Would you like us to contact you?
Answer type: Yes / No + phone number
CES scale options and when to use each
You will see three versions of the effort question. Each works, but they cannot be mixed in the same report:
- 1–7 agreement scale (this template). Most common, high number = low effort, enough points to see improvement. Best default.
- 1–5 effort scale (“Very difficult” → “Very easy”). Simpler to read, works well with smiley-style buttons on kiosks; slightly less sensitive to small changes.
- Original 1–5 “How much effort…” scale, where a low number is good. Avoid it unless you need comparability with older data — it confuses dashboards and readers.
Whichever you choose, write the scale into your report definitions so the number is never misread. Our guide to customer effort score explains the metric in more detail.
When and where to run it
CES belongs at the end of a task, not the end of a visit. Trigger it when the request closes:
- Service centre or branch after a transaction — kiosk at the exit, short version. Especially for paperwork-heavy services: applications, permits, account changes.
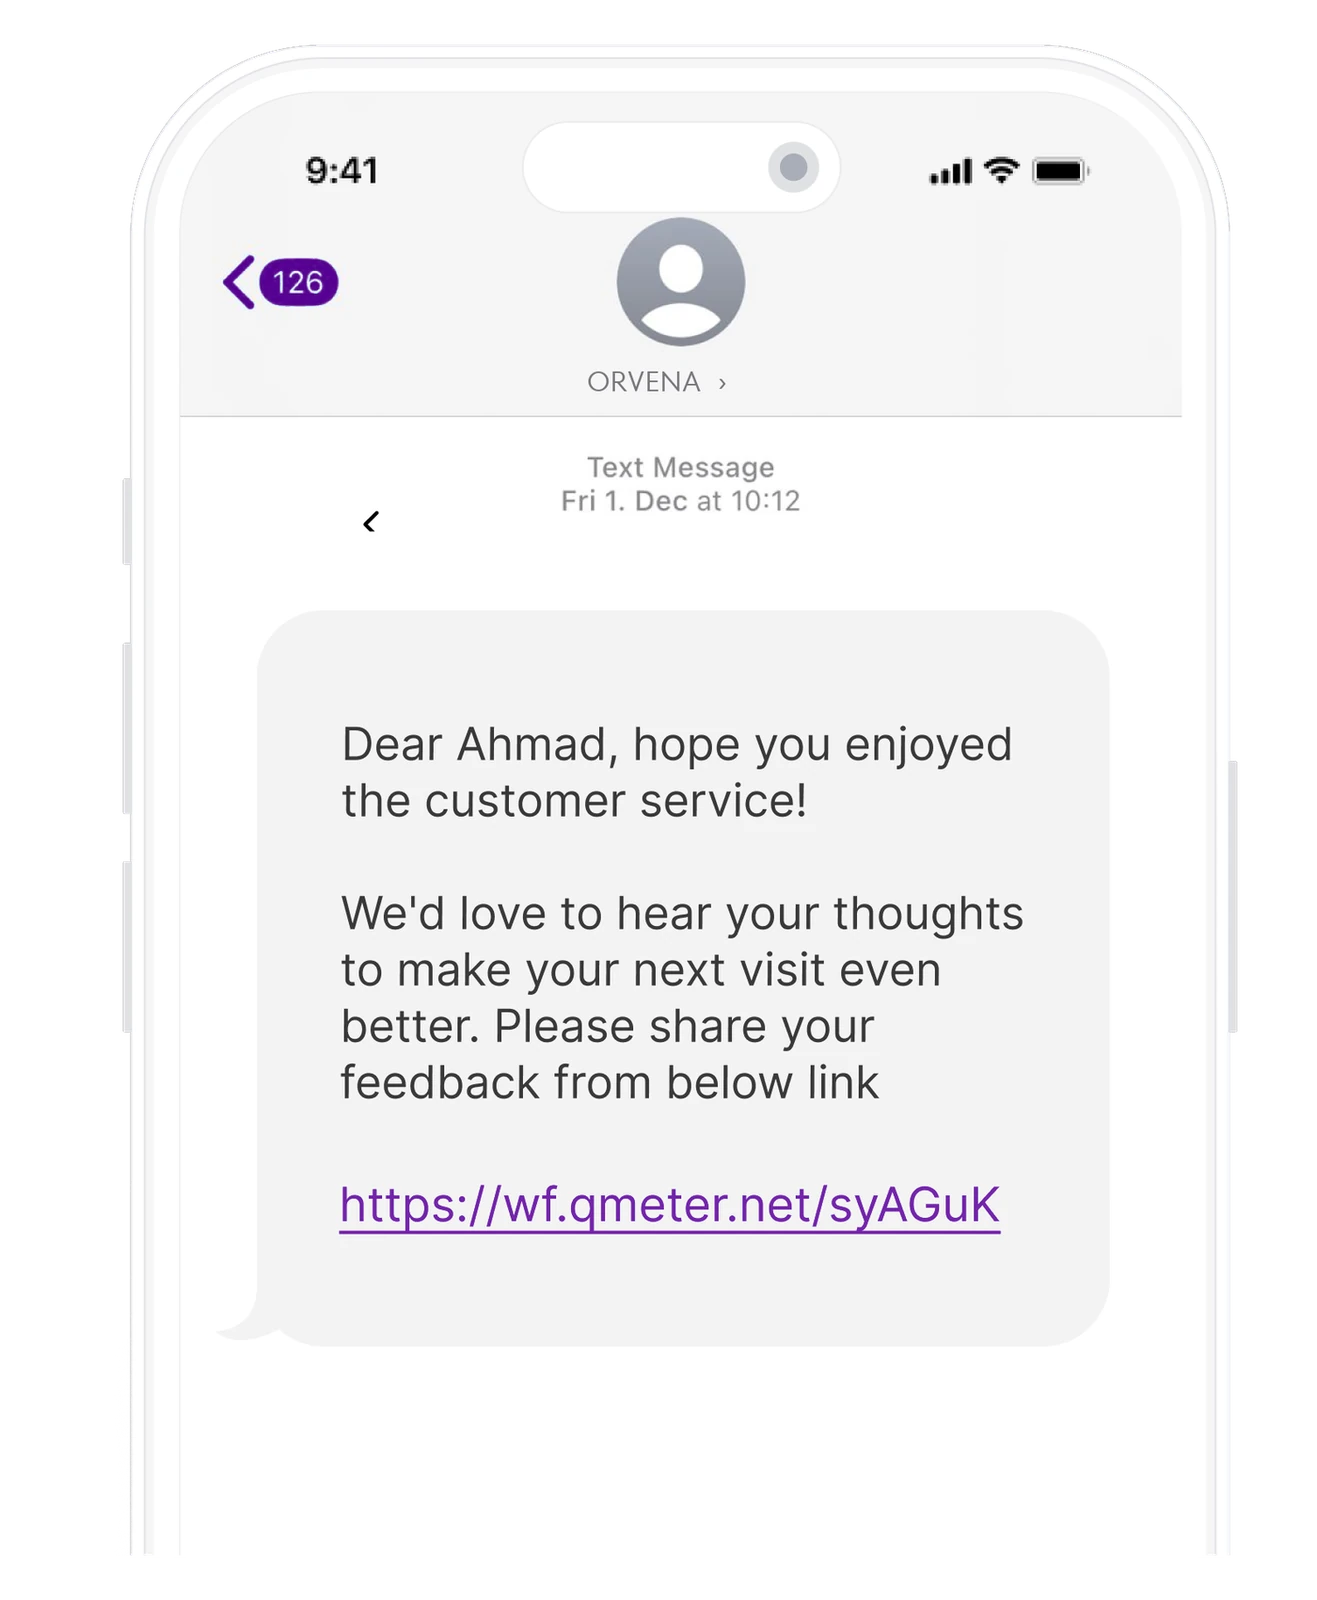
- After a support ticket is resolved — email or SMS link, full version. Send on closure, not on creation — you want the effort of the whole journey.
- After a phone call — SMS link, full version. Question 3 (number of contacts) is especially revealing here.
- After an online form, booking or payment — web widget on the confirmation page, short version. Catch drop-off reasons while the steps are still fresh.
- After a return or exchange — QR code on the receipt or SMS, full version. Returns are one of the highest-effort moments in retail.
How to analyse the results
Report CES as the share of customers who agree (5, 6 or 7 on the 1–7 scale), or as the average score — choose one. Example: 500 responses, 390 answers of 5–7 — 78% of customers found it easy. Track the share of 1–3 answers separately; that is your “high-effort” group.
- By task type (question 2). Rank tasks from easiest to hardest. The hardest high-volume task is usually your best improvement project.
- By number of contacts (question 3). Compare CES for first-contact versus repeat-contact customers; the gap shows the cost of not resolving the first time.
- By friction reason (question 5). “Repeating information” and “being transferred” point at process and systems; “unclear instructions” points at documents and signage.
- By location and channel. If one branch has much lower CES for the same task, look at how it handles that task differently.
CES works best next to CSAT and NPS rather than instead of them. The comparison of NPS, CSAT and CES shows how the three fit together.
Closing the loop on low scores
A high-effort answer is often a request that is still open. Treat it accordingly:
- Scores of 1–3, or “No” on question 4, open a ticket automatically with the task type and friction reason attached.
- The ticket is routed to the team that owns that task, not just to the location manager.
- If the customer left contact details, the owner finishes the request or explains the next step.
- On closure, record the root cause — a missing form, a policy, a system limitation — so process owners can remove the step.
See closed-loop feedback for SLA and escalation suggestions.
Use this template in Qmeter
In Qmeter you can rebuild this template with a Stars rating component set to 7 points (or Smiles for the 1–5 version), choice questions and show-if logic for the friction follow-up. The survey can be sent by SMS or email campaign when a request is closed, shown on kiosks in service halls, or opened from a QR code. Ticket generation rules can turn low ratings and keywords into follow-up tickets with SLA deadlines, and the report builder lets you pivot effort by branch, service and channel. You can test it in the 14-day free trial.
Frequently asked questions
What is the customer effort score question?
The common version is the statement [Company] made it easy for me to handle my request, rated on a 1–7 scale from strongly disagree to strongly agree. A higher score means lower effort.
How is customer effort score calculated?
Either as the percentage of customers who agree (5, 6 or 7 on the 7-point scale) or as the average score. Both are valid; use the same method every time so trends stay comparable.
When should I use CES instead of CSAT or NPS?
Use CES when the customer came to complete a task — resolve a problem, submit documents, make a return. CSAT fits general visits, and NPS fits long-term loyalty tracking.
Can CES be used on a kiosk?
Yes. Show the 7 points as large numbered buttons or switch to a 1–5 very difficult to very easy scale with smiley-style icons. Keep the kiosk version to three questions.
What is a good customer effort score?
There is no universal benchmark because scales and task types differ. Focus on your own trend and on reducing the share of customers who answer 1–3.
Who introduced the customer effort score?
CES was introduced by researchers at CEB, now part of Gartner, in the 2010 Harvard Business Review article Stop Trying to Delight Your Customers.
Measure it at every location — live in one day
Feedback kiosks, QR and web surveys, SMS and email, real-time alerts and follow-up tickets in one platform. 14-day free trial.
✓ 15 minutes · ✓ No commitment · ✓ A real CX person