Survey response rate
✓ Cloud or on-premise · ✓ Kiosk, QR, SMS, email and web · ✓ Live in one day
Survey response rate is the percentage of invited people who complete a survey: completed responses ÷ invitations delivered × 100. Short surveys, good timing and the right channel raise it. A low response rate makes scores volatile and biased toward customers with extreme opinions, so it is a quality check on every other metric.
What survey response rate tells you
A score is only as trustworthy as the group that produced it. If 2% of invited customers answer, the results describe that 2% — often the very happy and the very unhappy — not the customer base. Response rate is therefore less a performance metric than a confidence measure: it tells you how much weight the other numbers can carry.
It is also an early warning signal. A falling response rate usually appears before anything else goes wrong: customers tiring of surveys, a broken link, an offline kiosk, an SMS sender being filtered.
Response rate formula and example
Response rate = (completed responses ÷ invitations delivered) × 100
Example: an email survey goes to 4,000 customers; 200 bounce, so 3,800 are delivered. 950 people open it, 400 start it and 340 finish. Response rate = 340 ÷ 3,800 × 100 = 8.9%. Completion rate (finished ÷ started) = 340 ÷ 400 = 85%.
| Metric | Formula | What it diagnoses |
|---|---|---|
| Delivery rate | Delivered ÷ sent | Data quality, sender reputation |
| Open or click rate | Opened ÷ delivered | Subject line, sender, timing |
| Response rate | Completed ÷ delivered | Overall effectiveness |
| Completion rate | Completed ÷ started | Survey length and design |
For kiosks and QR codes there is no invitation list, so teams track responses per visitor (responses ÷ footfall or transactions) or simply responses per day per location, and watch the trend.
What moves survey response rates
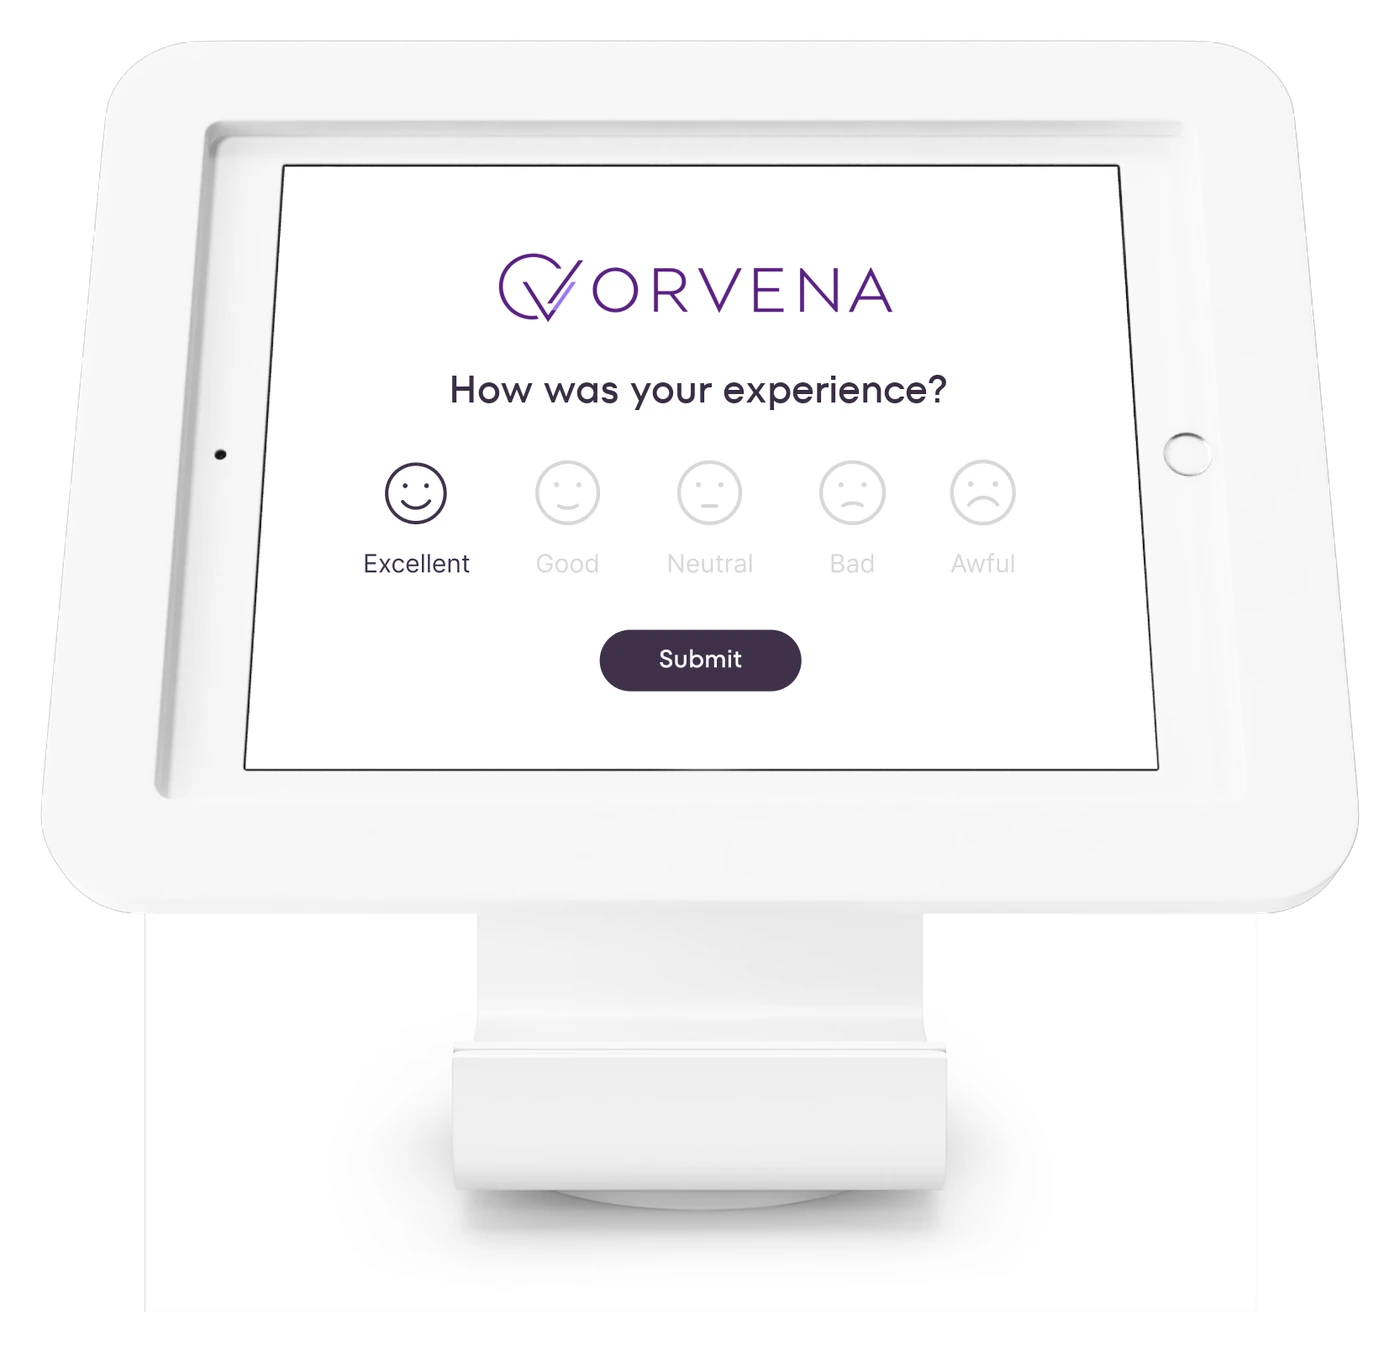
- Channel and moment. A kiosk at the exit or a QR code at the table catches customers while the experience is fresh; an email two days later competes with everything else in the inbox.
- Length. Every extra question loses some respondents. Transactional surveys should take under a minute.
- Relevance. “How was your visit to our Riverside branch today?” outperforms “Please take our customer survey”.
- Language. Customers answer more readily in their own language.
- Trust and visible action. Customers who see feedback lead to change keep answering.
- Frequency. Asking the same customer too often lowers response — see survey fatigue.
How to improve your survey response rate
- Cut the survey to the questions you will act on.
- Ask in the moment — kiosk, QR or an SMS within an hour.
- Use one tap to start — put the first rating question directly on the screen or in the message.
- Offer the survey in the customer’s language with a visible language switch.
- Personalise the invitation with the branch, date or service.
- Close the loop visibly — “You told us, we changed it” messages keep customers engaged.
- Test variants. Compare two versions of the survey or invitation and keep the better one.
Qmeter supports these levers: kiosk, QR, web, SMS and email channels; surveys in more than 100 languages with AI-assisted translation; A/B tests of two to five survey variants with a winner chosen after a set number of responses; and campaign reports with opens and clicks. See multilingual surveys and survey campaigns.
Response rate and sample size
A high response rate is reassuring, but what ultimately decides whether a score is reliable is the number of responses behind it. For a percentage such as top-2-box CSAT, a common rule of thumb for the margin of error at 95% confidence is roughly 1 ÷ √n, where n is the number of responses:
| Responses (n) | Approximate margin of error |
|---|---|
| 100 | ± 10 percentage points |
| 400 | ± 5 percentage points |
| 1,000 | ± 3 percentage points |
So a branch with 100 responses a month that moves from 78% to 72% may not have changed at all, while the same move over 1,000 responses is a real signal. NPS, which subtracts two percentages, has a wider margin than a single percentage. When volumes are low, report longer periods or combine similar locations rather than reacting to monthly noise.
Common mistakes
- Dividing by invitations sent rather than delivered, which hides list-quality problems.
- Comparing response rates across channels as if they were the same thing.
- Chasing volume with incentives that attract answers from people who did not use the service.
- Ignoring low-response branches, where a handful of answers can swing the score wildly.
Frequently asked questions
How do you calculate survey response rate?
Divide the number of completed responses by the number of invitations successfully delivered, then multiply by 100. For kiosks and QR codes, track responses per visitor or per day instead.
What is a good survey response rate?
It varies widely by channel, audience and relationship, so there is no single benchmark. Compare against your own trend per channel and location, and make sure each reported score rests on enough responses to be stable.
What is the difference between response rate and completion rate?
Response rate compares completed surveys with everyone invited. Completion rate compares completed surveys with everyone who started, so it isolates the effect of survey length and design.
Why are survey response rates falling?
Common causes are too many surveys, surveys that are too long, invitations sent too late, poor list quality, a broken device or link, and customers who never see their feedback lead to any change.
Measure it at every location — live in one day
Feedback kiosks, QR and web surveys, SMS and email, real-time alerts and follow-up tickets in one platform. 14-day free trial.
✓ 15 minutes · ✓ No commitment · ✓ A real CX person