Museum visitor NPS: what is a good score, and how to read yours
✓ Cloud or on-premise · ✓ Kiosk, QR, SMS, email and web · ✓ Live in one day
There is no published, sector-wide NPS benchmark for museums that a board can quote with confidence: the visitor studies that do exist use different scales, different samples and different moments of asking, so their figures are not comparable with each other or with your kiosk at the exit. What a museum can do is read its own score correctly: know the margin of error at its sample size, compare seasons and exhibitions like for like, and build an internal benchmark that improves every quarter. This guide shows how, with the maths, and the free tool below calculates it for your numbers.
Why published museum benchmarks do not agree
Three recent, real visitor studies illustrate the problem:
- Culture Counts, Arts and Culture Benchmark Report FY23/24: 93,000 survey responses across more than 500 surveys, scored out of 100 on dimensions such as aesthetic experience (median 88), inclusion (84) and challenge (73). No NPS is reported.
- Museums Aotearoa, 2026 National Visitor Survey (New Zealand): 135 visitors across museums and galleries; overall satisfaction 9.3 out of 10, up from 8.9 in 2025; 58.6% rated their visit 10/10. A 10-point satisfaction scale, not NPS.
- accesso, Voice of the Visitor 2026: sentiment analysis of 813,000 online remarks from 500 attractions in 37 countries; history and cultural institutions average 4.62 out of 5 against an industry average of 4.18. Online reviews, not a survey.
Different scales, different samples (135 people versus 93,000 answers versus 813,000 reviews) and different moments of asking (at the exit, at home, weeks later online). None of them can be set against your own NPS. Treat any single "museums average X" figure you find online with the same caution unless its method is published.
Sample size: how far your NPS can be trusted
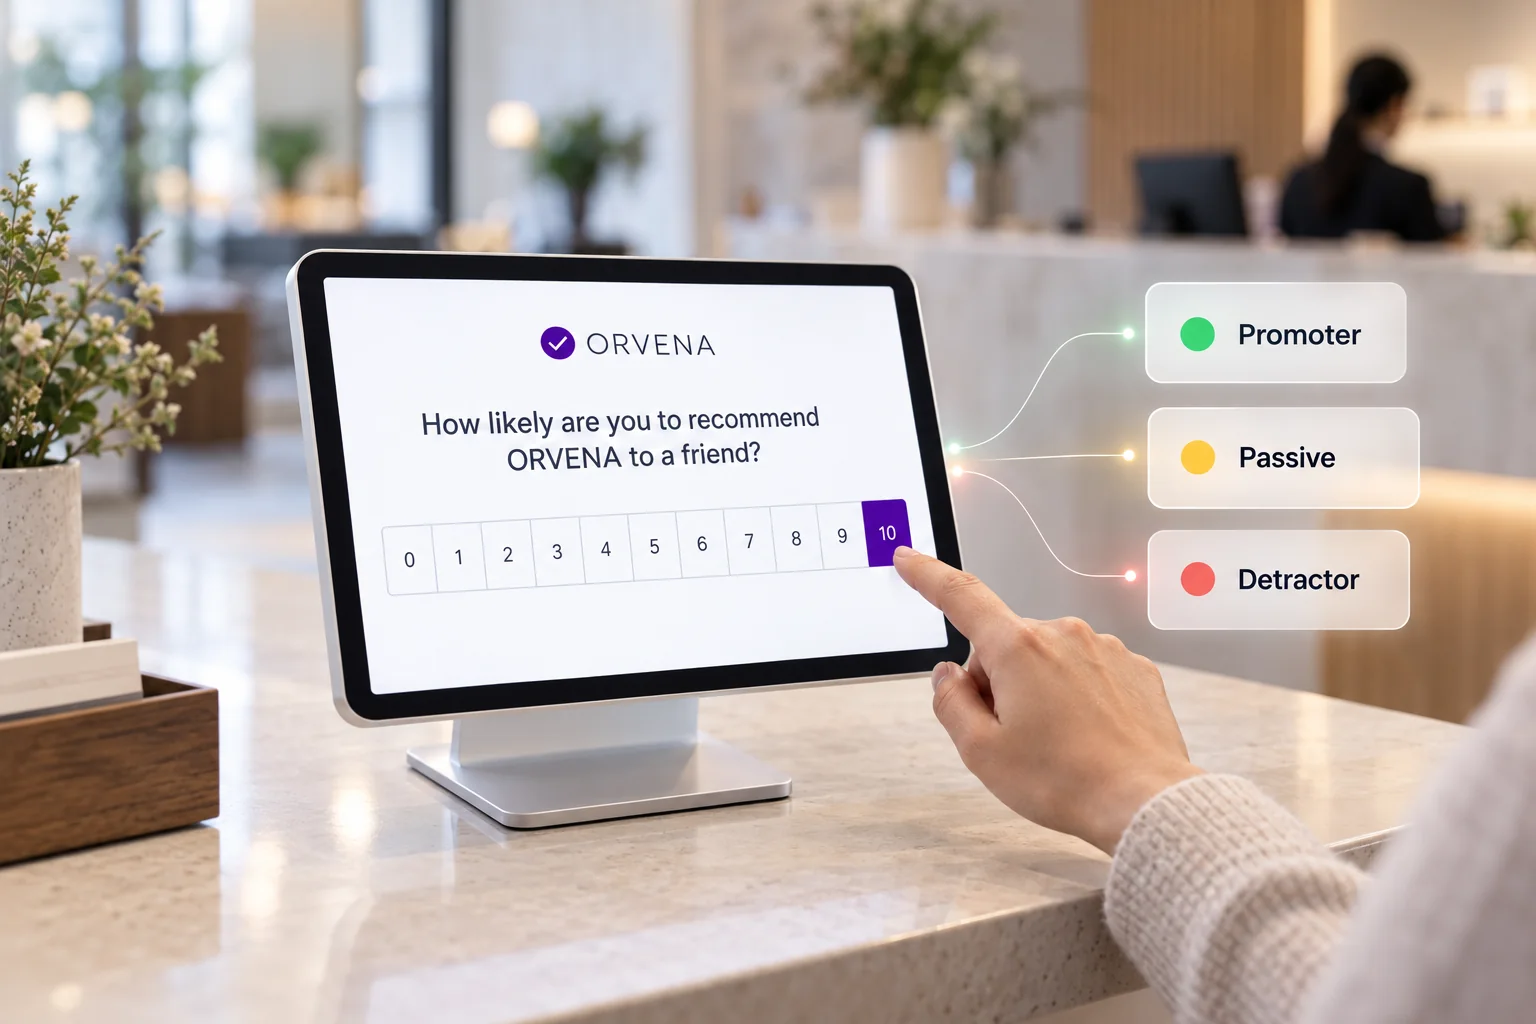
NPS is the share of promoters (9–10) minus the share of detractors (0–6). Because it is built from two shares, its margin of error is wider than most people expect. With pP the promoter share and pD the detractor share, the variance of one answer is pP + pD − (pP − pD)², and the 95% margin of error in points is roughly 1.96 × √(variance ÷ n) × 100.
| Responses (n) | Example: 50% promoters, 20% detractors (NPS +30) |
|---|---|
| 100 | about ±15 points |
| 400 | about ±8 points |
| 1,000 | about ±5 points |
| 4,000 | about ±2.5 points |
Two practical rules follow. First, report the response count beside every score. Second, do not read a change smaller than the margin as a change: a move from +30 to +34 on 200 answers a month is noise, on 4,000 it is a signal. The tool on this page does this calculation for your own figures.
Seasonality, school holidays and the weather
Museum audiences change with the calendar: school groups in term time, families in the holidays, international visitors in the high season, locals in the rain. Each group answers differently, so a museum that compares July with October is mostly measuring who came, not what changed.
- Compare the same period year on year, or compare weeks within one season.
- Record the language and, where you ask it, the visitor origin with every answer, so the mix can be read next to the score.
- Keep the question and the channel constant; a kiosk at the exit and an e-mail a week later reach different people.
Comparing exhibitions and galleries fairly
The most useful museum benchmark is internal: the permanent collection against the temporary exhibition, this exhibition against the previous one in the same space, the café against the shop. For that comparison to be fair:
- Measure each space separately, with its own kiosk or QR code, so the answer is tied to the place.
- Ask the same one question in every space, with the same scale.
- Combine correctly. Add up promoters and detractors across spaces and calculate once; averaging the NPS of each space over-weights the small ones.
- Read comments by space. A score tells you where; the comments tell you why.
How to build an internal benchmark in one season
If no external number can be trusted, make your own, in four steps:
- Baseline: run the same question at every touchpoint for one full season and record the score, the margin and the response count per space.
- Target: set a target per space that is larger than its margin of error, for example "+5 points at 1,000 answers", not "+2 points at 150".
- Act on the lowest space first: the comments show the reason; a low rating should open a ticket for the responsible person the same day.
- Report the trend, not the snapshot: season against the same season last year, with the response counts, to the director and the board.
Qmeter runs this as a continuous programme: one survey per touchpoint in the visitor's language, live NPS and satisfaction per gallery with the response count beside it, tickets for low ratings and scheduled reports per season. See visitor experience measurement for museums and, for Abu Dhabi operators, what the DCT guidelines ask for.
Sources
- Culture Counts: Your free Arts and Culture Benchmark Report FY23/24 (24 September 2024)
- Museums Aotearoa: 2026 National Visitor Survey (1 July 2026)
- accesso: What visitors really think about museums (Voice of the Visitor 2026)
- Reichheld, F. (2003). "The One Number You Need to Grow", Harvard Business Review — the origin of NPS.
Frequently asked questions
What is a good NPS for a museum?
No sector body publishes a museum NPS benchmark we could verify, and the visitor studies that exist use different scales and samples. A good score is one that is above your own baseline by more than its margin of error, at the same touchpoint and season. The tool on this page calculates the margin for your numbers.
How many survey responses does a museum need?
It depends on the decision. With 50% promoters and 20% detractors, 100 answers give a margin of about ±15 points, 400 about ±8, 1,000 about ±5 and 4,000 about ±2.5. Use enough answers that the change you want to detect is larger than the margin.
Should museums use NPS or a satisfaction score?
Both. NPS is the one number a board or a tourism authority asks for; satisfaction per question (ticketing, wayfinding, exhibitions, cleanliness) tells the team what to fix. Always report the response count beside each.
Can I compare my museum with hotels or airports?
Not meaningfully. The audience, the moment and the question differ. Compare your museum with itself over time, and gallery against gallery within one visit.
Why does my NPS drop in the school holidays?
Most often because the audience changes, not the museum: families and school groups answer differently from adult visitors. Compare the same period year on year and read the visitor mix next to the score.
How does Qmeter calculate NPS across galleries?
Each gallery, exhibition and commercial area has its own touchpoint. The dashboard shows NPS and satisfaction per space with the response count, and the combined score is calculated from the total promoters and detractors, not by averaging the spaces.
Measure it at every location — live in one day
Feedback kiosks, QR and web surveys, SMS and email, real-time alerts and follow-up tickets in one platform. 14-day free trial.
✓ 15 minutes · ✓ No commitment · ✓ A real CX person