Customer churn
✓ Cloud or on-premise · ✓ Kiosk, QR, SMS, email and web · ✓ Live in one day
Customer churn is the loss of customers who stop doing business with you over a given period. The churn rate is calculated as customers lost during the period ÷ customers at the start of the period × 100. Churn is a lagging result of customer experience: by the time it shows, the cause is weeks or months old.
What customer churn means
“Churn” describes customers leaving — cancelling a contract, closing an account, or simply no longer visiting. In subscription businesses churn is visible on a specific date. In retail, hospitality or healthcare it is quieter: the customer just does not come back, so churn has to be defined as inactivity over a period (for example, no visit in 6 months for a customer who used to visit monthly).
Two kinds are worth separating:
- Voluntary churn — the customer chooses to leave: a bad experience, a better offer, a move, a changed need.
- Involuntary churn — the relationship ends without a decision: a failed payment, an expired card, a closed location.
Customer experience work targets voluntary churn, and especially the share caused by fixable service problems.
Churn rate formula and worked example
Churn rate = (customers lost during the period ÷ customers at the start of the period) × 100
Example: a fitness club starts the quarter with 2,000 members. During the quarter 150 members cancel and 220 new members join. Churn rate = 150 ÷ 2,000 × 100 = 7.5% for the quarter. New members are not subtracted from the numerator — churn measures loss, not net change. The mirror metric, customer retention rate, would be (2,070 − 220) ÷ 2,000 × 100 = 92.5%.
Two refinements matter in practice:
- Keep the period consistent. Monthly and annual churn are not interchangeable; a small monthly rate compounds into a much larger annual one.
- Consider revenue churn as well. Losing ten small customers and losing one large one can produce the same customer churn rate but very different financial damage.
Why churn matters
Churn is expensive because replacing a customer usually costs more than keeping one: acquisition spend, onboarding effort and the lost relationship history. The best-known estimate comes from Frederick Reichheld’s research with Bain & Company, which found that increasing customer retention rates by 5 percentage points can increase profits by 25% to 95%, depending on the industry. The exact figure varies, but the direction is consistent: small changes in churn have large financial effects.
Early warning signals of customer churn
Because churn arrives late, CX teams watch the signals that precede it:
- Detractor responses — customers scoring 0–6 on the NPS question. See detractor.
- Unresolved complaints — a ticket that stays open, or is reopened, is a strong risk signal.
- Falling visit or usage frequency — fewer visits, smaller baskets, fewer logins.
- Negative sentiment in comments, especially mentions of competitors, price or “last time”.
- Silence after a bad experience — customers who stop answering surveys after a low score.
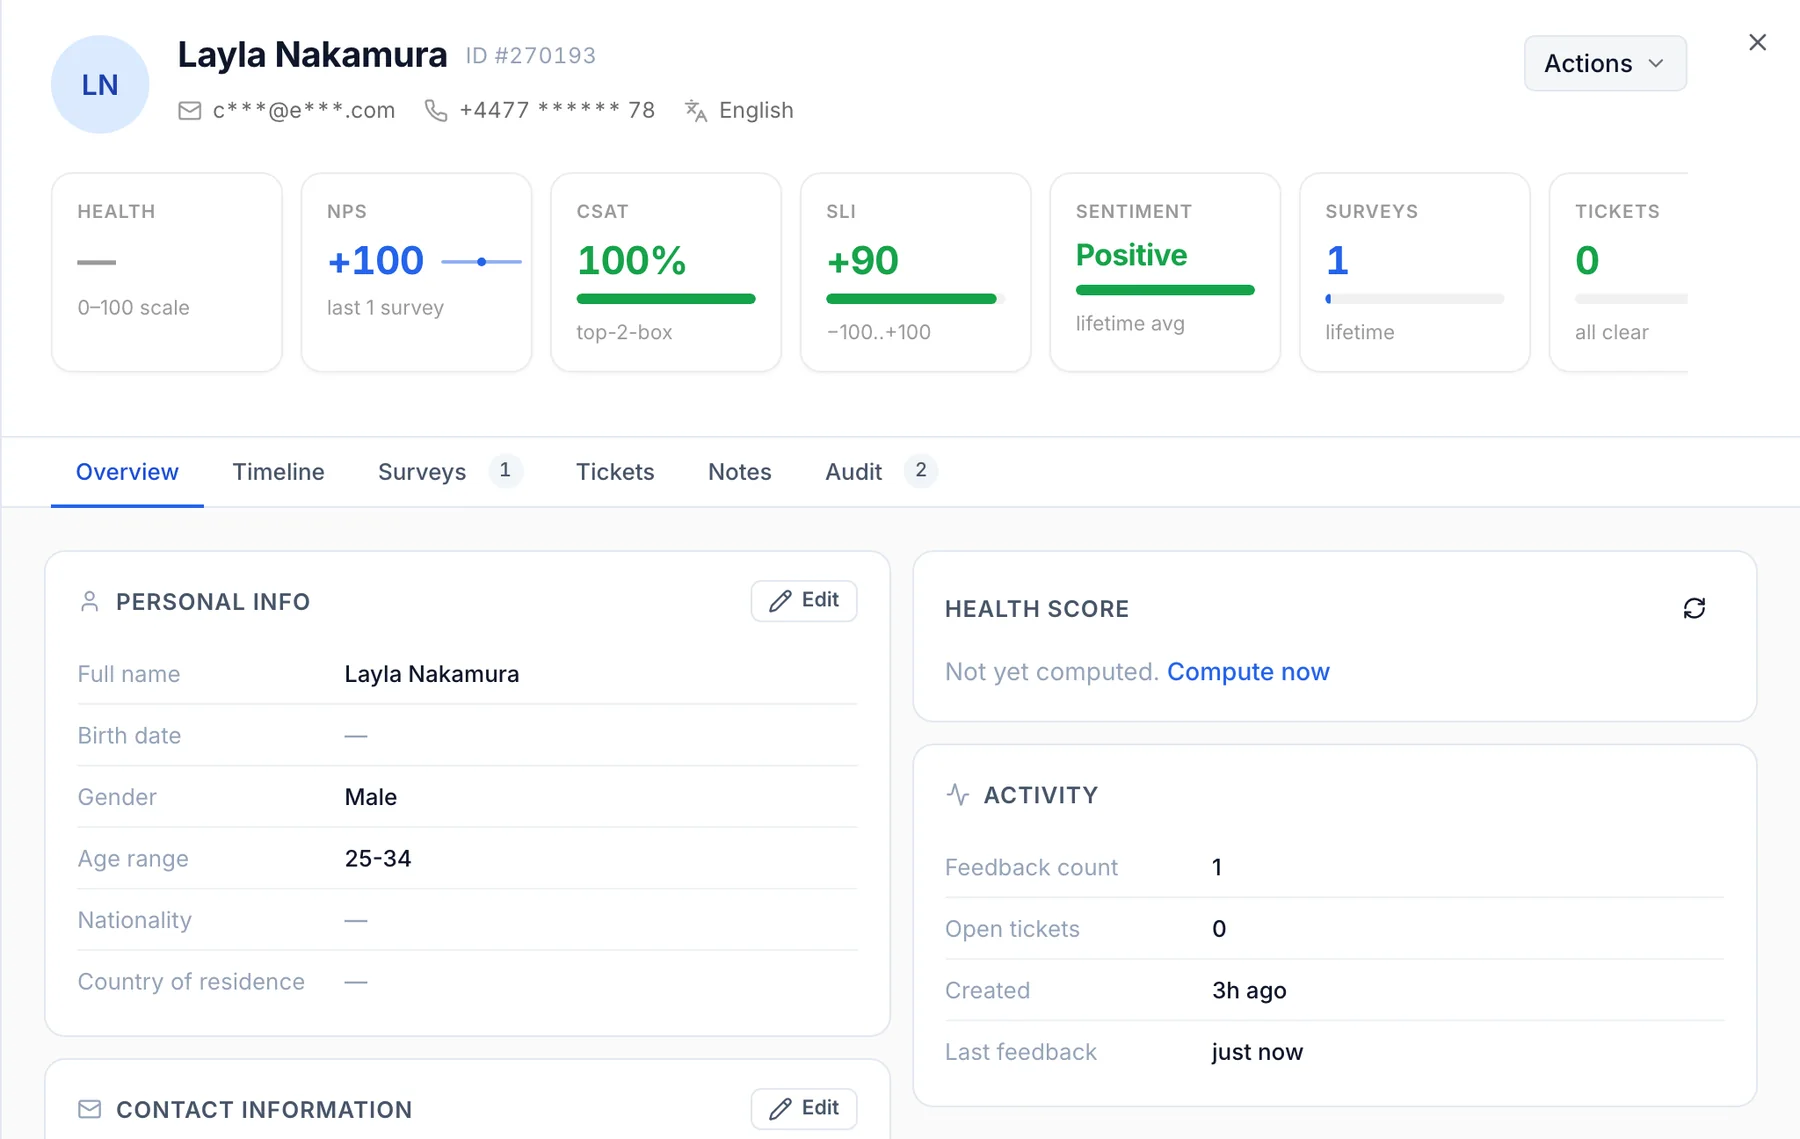
Qmeter combines several of these signals into a customer Health Score from 0 to 100 — built from NPS, CSAT, recent activity and ticket load — and flags customers whose score falls as at risk, so someone can contact them while the relationship is still recoverable.
How to reduce customer churn with feedback
- Measure at the touchpoints that predict leaving — onboarding, problem resolution, renewal.
- Alert on negative feedback in real time and open a ticket with an owner and a deadline.
- Contact detractors quickly. A same-day call often recovers a relationship that a week of silence ends.
- Fix the recurring cause behind repeated complaints — the outer feedback loop.
- Ask leavers why. An exit question turns churn into specific reasons a win-back message can address.
Common churn measurement mistakes
- Counting new customers against losses, which hides churn behind growth.
- Mixing periods — comparing a monthly rate with an annual one.
- Reading churn only quarterly instead of watching the leading signals weekly.
- Treating all churn as one number instead of splitting by segment, location and reason.
For cohort methods and a full retention playbook, read our guide to customer churn rate and retention.
Frequently asked questions
How do you calculate customer churn rate?
Divide the number of customers lost during a period by the number of customers at the start of that period, then multiply by 100. New customers acquired during the period are not included in the calculation.
What is the difference between churn and retention?
Churn rate measures the share of customers you lost; retention rate measures the share you kept, excluding newly acquired customers. When both are calculated on the same base, they add up to 100%.
What causes customer churn?
Common causes are poor service experiences, unresolved complaints, high effort to get things done, better competing offers, price changes and life changes such as moving. Feedback and exit questions show which causes apply to your business.
Can customer feedback predict churn?
Feedback gives early warning signals: detractor scores, negative comments, unresolved or reopened complaints and falling engagement tend to appear before a customer leaves, which gives time to intervene.
What is a good churn rate?
It depends heavily on industry, contract model and period, so there is no universal target. The most useful benchmark is your own trend by segment and location, and the gap between your best and worst branches.
Measure it at every location — live in one day
Feedback kiosks, QR and web surveys, SMS and email, real-time alerts and follow-up tickets in one platform. 14-day free trial.
✓ 15 minutes · ✓ No commitment · ✓ A real CX person