Customer satisfaction index (CSI)
✓ Cloud or on-premise · ✓ Kiosk, QR, SMS, email and web · ✓ Live in one day
A customer satisfaction index (CSI) is a single score, usually 0–100, that combines several satisfaction measures — for example ratings of staff, speed, cleanliness and value — into one weighted number. The term describes both national indices that compare companies and industries, and the internal CSI an organisation builds to track its own service quality.
What a customer satisfaction index is
A single satisfaction question (“How satisfied were you?”) is quick, but it hides why the customer felt that way. An index solves this by asking about several attributes of the experience and combining them, with weights, into one number. The result is more stable than a single question and can be broken back down into its parts when it moves.
The term is used in two different senses:
- National and industry indices. The best known is the American Customer Satisfaction Index (ACSI), established in 1994 at the University of Michigan, which publishes 0–100 scores for companies and industries based on large customer samples and a statistical model linking expectations, perceived quality and perceived value to satisfaction and loyalty. In the UK, the Institute of Customer Service publishes the UK Customer Satisfaction Index (UKCSI). These are external benchmarks; a company does not calculate them itself.
- Company CSI. An internal index built from your own surveys, used to compare branches, services and periods. This is what most people mean when they ask how to calculate a CSI.
How to calculate a customer satisfaction index
- Choose the attributes that define the experience — typically four to eight (for example: staff courtesy, waiting time, competence, cleanliness, value).
- Rate each on the same scale (for example 1–5).
- Assign weights that add up to 1 (or 100%). Weights can come from customers (“how important is…?”), from key driver analysis, or from management judgement.
- Convert each average to 0–100: (average − scale minimum) ÷ (scale maximum − scale minimum) × 100.
- Combine: CSI = Σ (weight × attribute score on 0–100).
Example (illustrative data for one branch, 1–5 scale):
| Attribute | Average rating | Score (0–100) | Weight | Weighted |
|---|---|---|---|---|
| Waiting time | 3.4 | 60 | 0.30 | 18.0 |
| Staff courtesy | 4.6 | 90 | 0.25 | 22.5 |
| Competence | 4.2 | 80 | 0.25 | 20.0 |
| Cleanliness | 4.0 | 75 | 0.20 | 15.0 |
| CSI | 75.5 | |||
The index says the branch is doing reasonably well; the breakdown says exactly where the points are lost — waiting time, which also carries the highest weight.
How to use a CSI
- Compare like with like. The same attributes, weights and scale across branches and periods; change any of them and the trend breaks.
- Always publish the breakdown next to the index, so a falling CSI leads straight to the attribute responsible.
- Pair it with a loyalty metric. CSI says how satisfied customers are; NPS says whether they would recommend you. They usually move together, but not always.
- Re-check the weights yearly with key driver analysis — what customers care about changes.
Qmeter’s own index, the Satisfaction Level Indicator (SLI), follows the same idea with a different method: every answer option in every survey carries a score, and SLI = (current case × 100) ÷ best case, on a scale from −100 to 100. Because it uses every answer rather than a single question, it works as one comparable service-quality number across branches and periods. Read more in what is SLI.
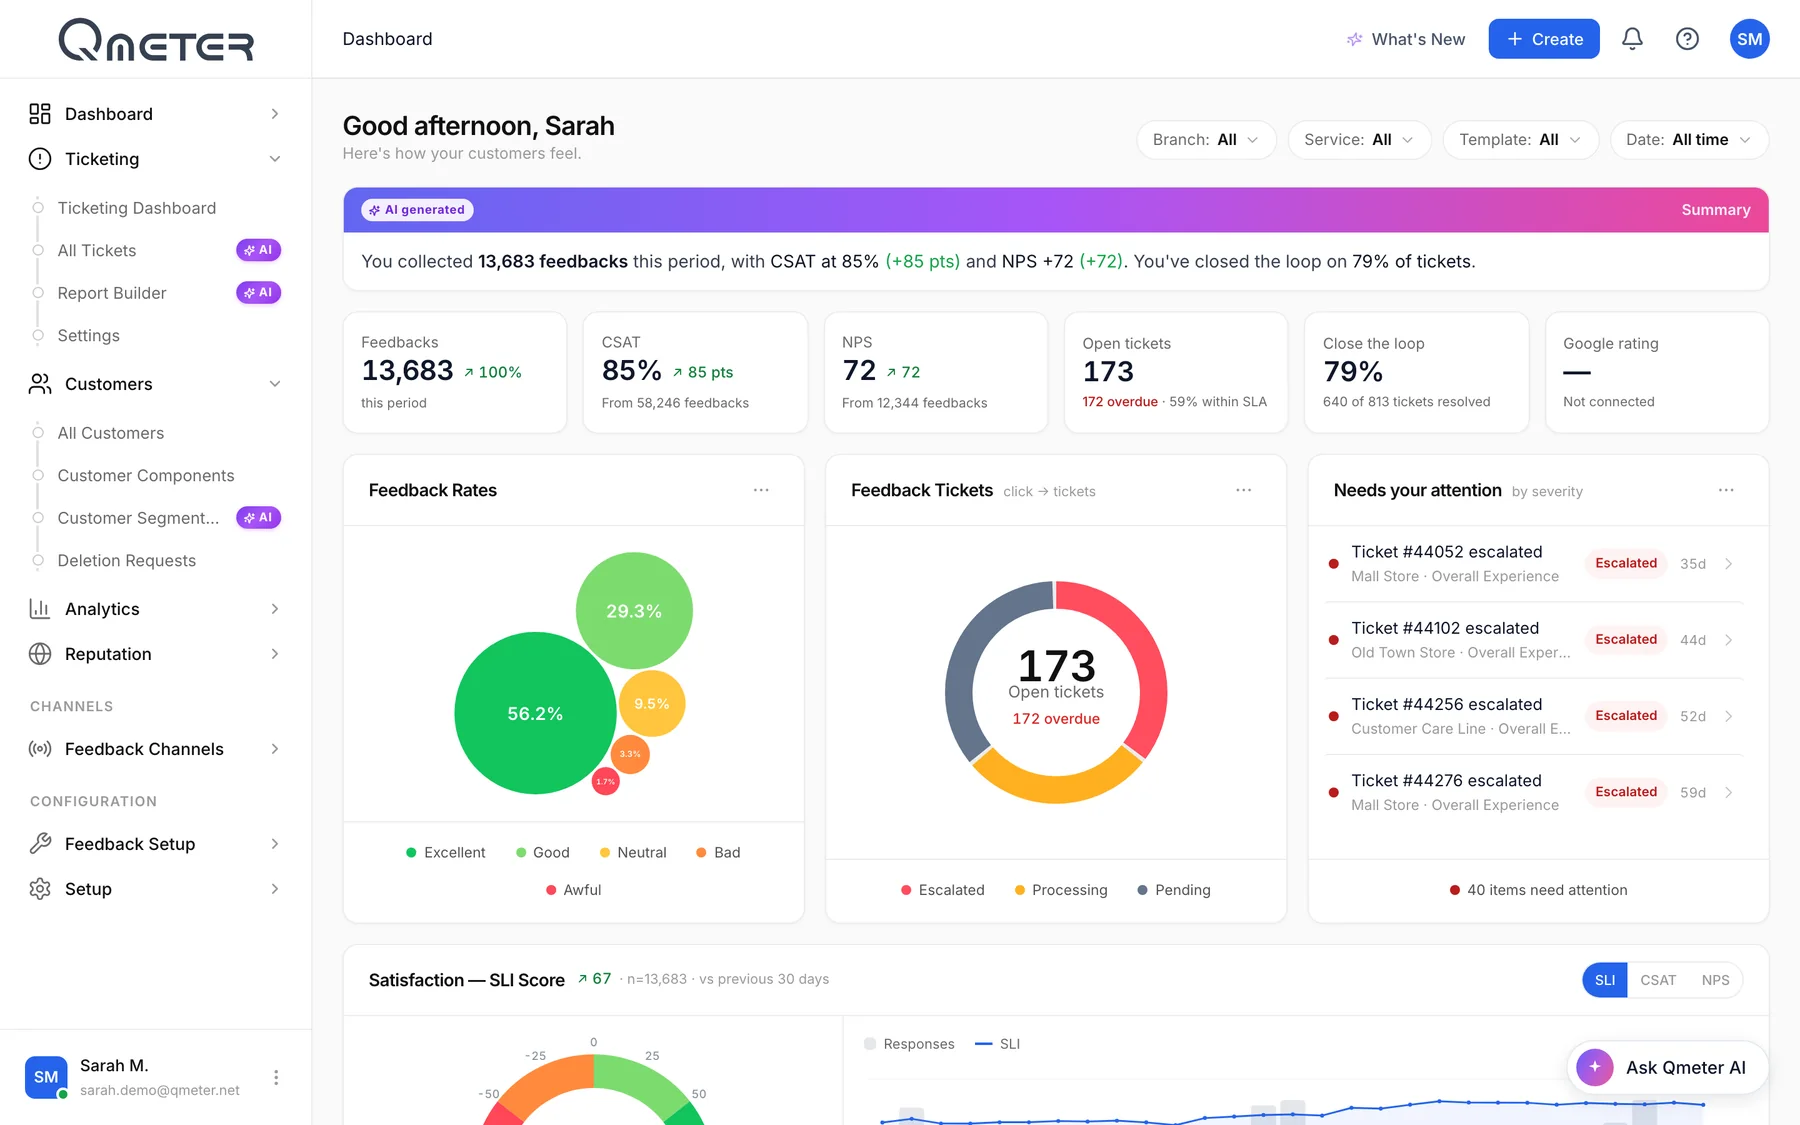
CSI vs CSAT vs NPS vs SLI
| Metric | What it combines | Scale | Best for |
|---|---|---|---|
| CSAT | One satisfaction question | % satisfied (0–100%) | Individual interactions |
| NPS | One recommendation question | −100 to +100 | Loyalty and relationship trend |
| Company CSI | Several weighted attribute ratings | Usually 0–100 | Service quality with a built-in breakdown |
| SLI (Qmeter) | Every answer option in every survey, against the best case | −100 to 100 | One comparable number across branches and periods |
None of these is “the right one”. Choose one headline metric for management, keep the others for diagnosis, and never change definitions mid-year.
Common mistakes
- Comparing your internal CSI with a national index score. The methods, samples and scales are different, so the numbers are not comparable.
- Arbitrary weights that nobody can explain — or weights that change every quarter.
- Too many attributes. A 20-attribute index is a long survey and an unreadable breakdown.
- Reporting the index alone. Without the breakdown, nobody knows what to fix.
Frequently asked questions
What is a customer satisfaction index?
A customer satisfaction index (CSI) combines ratings of several aspects of the experience into one weighted score, usually from 0 to 100. It can be an external national index or an internal index a company builds from its own surveys.
How do you calculate a CSI score?
Rate several attributes on the same scale, convert each average to a 0–100 score, multiply each by its weight (weights add up to 1) and add the results together.
What is the difference between CSI and CSAT?
CSAT usually measures satisfaction with one interaction through one question, reported as the percentage of satisfied respondents. CSI combines several attribute ratings into a weighted index, which is more stable and easier to break down.
What is the American Customer Satisfaction Index?
The American Customer Satisfaction Index (ACSI), established in 1994 at the University of Michigan, publishes 0–100 satisfaction scores for companies and industries based on large customer samples and a statistical model.
Measure it at every location — live in one day
Feedback kiosks, QR and web surveys, SMS and email, real-time alerts and follow-up tickets in one platform. 14-day free trial.
✓ 15 minutes · ✓ No commitment · ✓ A real CX person