Customer journey mapping
✓ Cloud or on-premise · ✓ Kiosk, QR, SMS, email and web · ✓ Live in one day
Customer journey mapping is the process of laying out every stage, touchpoint, action and emotion a customer goes through with a business — from first discovery to purchase, service and renewal — in one visual map. Its purpose is practical: to show where customers struggle or drop off, and where feedback should be collected to prove it.
What customer journey mapping is
A customer journey is the full sequence of interactions a customer has with an organisation. A customer journey map is the diagram of that sequence. Customer journey mapping is the work of building the map — gathering evidence, agreeing on the stages and identifying the moments that decide whether the customer stays.
Journey maps are valuable because journeys cut across departments. Marketing makes a promise, sales confirms it, operations delivers it and support absorbs the consequences when it goes wrong. No single department sees the whole path, so problems that sit between teams — a hand-off, a missing update, a policy that contradicts an advert — stay invisible until somebody draws the journey end to end.
A useful map is built from evidence: feedback data, complaint records, observed behaviour and staff knowledge. A map built only from a workshop’s assumptions describes how the company thinks the journey works, which is rarely how customers experience it.
What a journey map contains
| Layer | Question it answers | Example (bank account opening) |
|---|---|---|
| Stages | What phases does the customer go through? | Research → apply → verify identity → first use |
| Touchpoints | Where do they interact with us? | Website, branch visit, phone call, welcome email, app |
| Customer actions | What are they trying to do? | Compare accounts, bring documents, activate a card |
| Emotions and pain points | How does it feel; where does it hurt? | Uncertainty about documents; waiting for approval |
| Owners | Which team is responsible? | Digital, branch network, operations, contact centre |
| Measurement | How do we know how it went? | Kiosk at the branch exit, SMS after approval, in-app rating |
The last row is the one most maps leave out — and the one that turns a diagram into a management tool. Each touchpoint that matters should have a feedback channel that fits it.
Customer journey mapping in six steps
- Pick one journey and one customer type. “New retail customer opening an account” is mappable; “all customers” is not.
- Collect evidence first. Pull existing feedback, complaint themes, call reasons and drop-off data before the workshop.
- Draft the stages and touchpoints with people from every team that touches the journey, including front-line staff.
- Mark the moments of truth — the few touchpoints where the experience is won or lost (first contact, waiting, problem resolution, renewal).
- Instrument them. Assign a short survey and a channel to each moment of truth: a kiosk where customers leave a building, a QR code where they sit or wait, SMS or email after a remote interaction.
- Review the map against live data every quarter, and redraw it when the scores or complaint themes say the journey has changed.
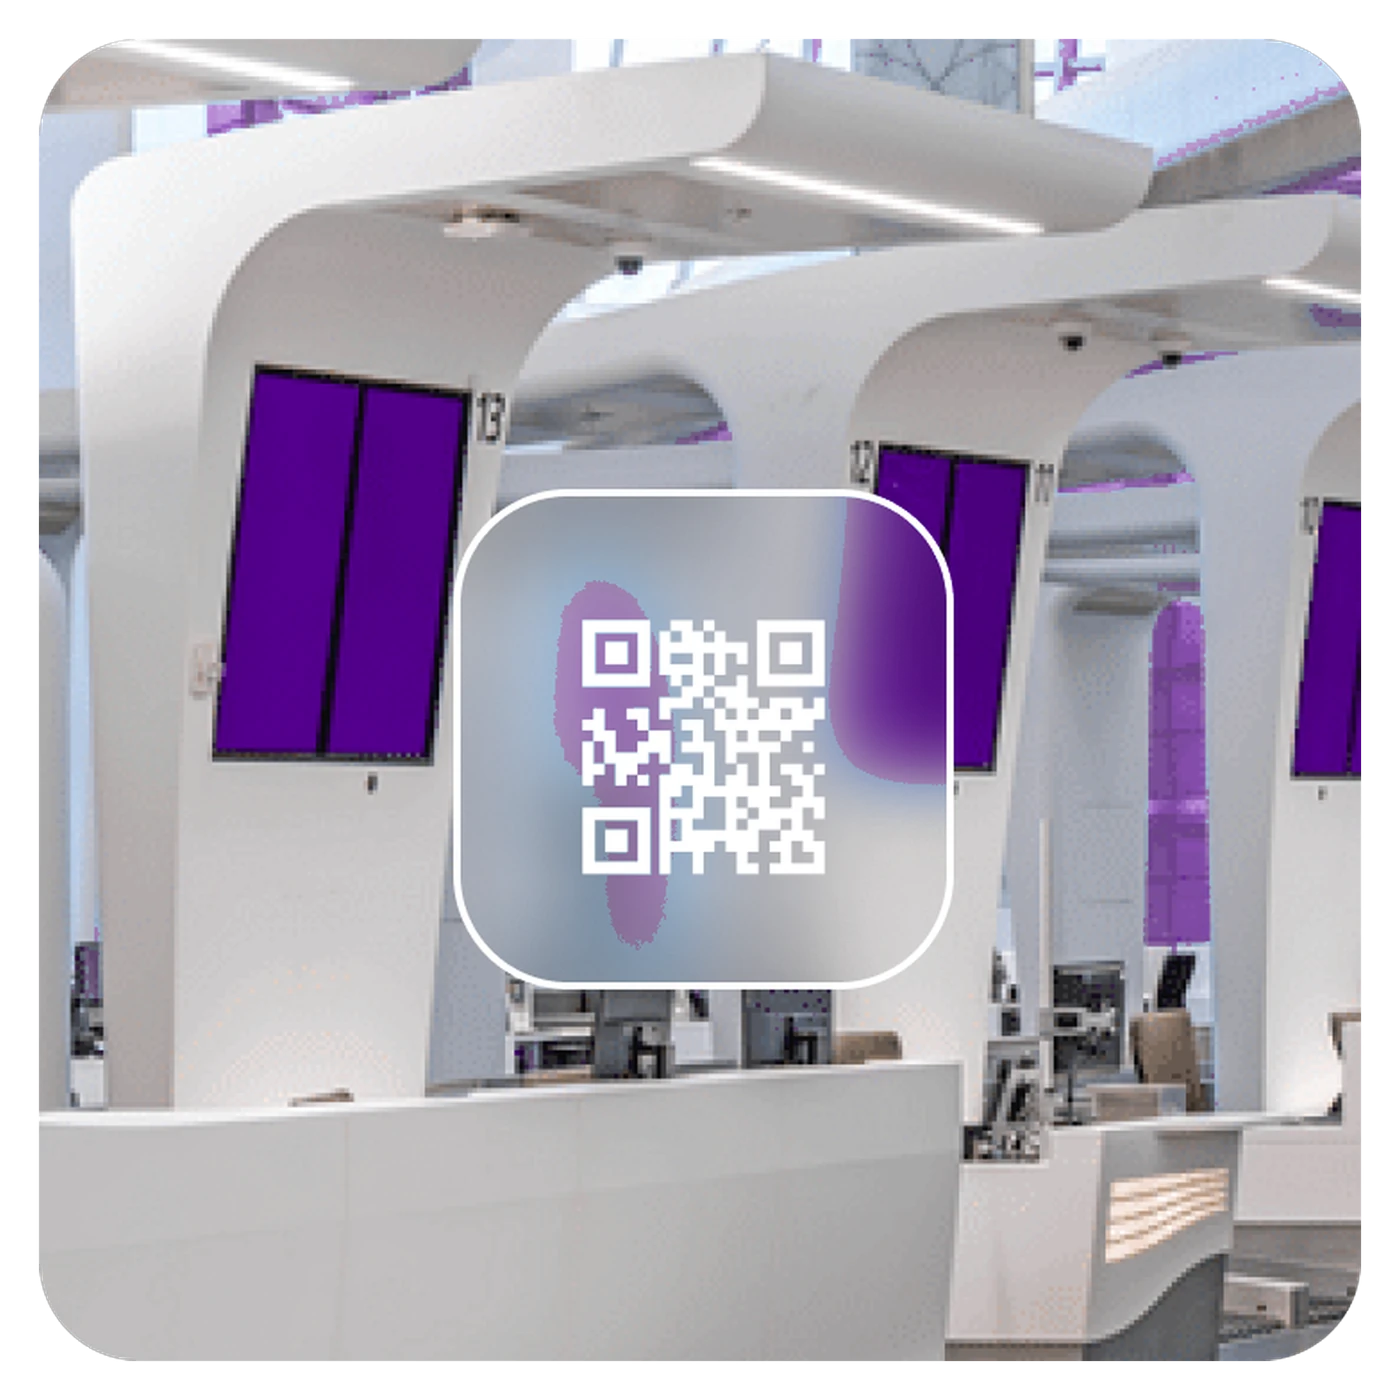
Example: mapping a clinic visit
Example: a multi-site clinic maps the outpatient journey — booking, arrival and registration, waiting, consultation, payment and follow-up. The workshop assumes the consultation is the weak stage. The evidence says otherwise: a tablet at the exit and an SMS survey after the visit (example: 1,200 responses over a month) show consultation scores are high, while comments cluster around registration queues and unclear instructions for follow-up tests.
The clinic changes two things — an extra registration desk at peak hours and a printed next-steps sheet — and keeps both surveys running. The map now has a measured score at each stage, so the next review starts from data rather than opinion.
How to measure a customer journey
- Per-touchpoint satisfaction — CSAT or a smiley rating at each instrumented step, compared stage by stage.
- Effort at hand-offs — a customer effort question (“How easy was it to…?”) after steps that involve forms, transfers or waiting.
- Overall loyalty — a periodic NPS relationship survey to see whether journey fixes change the bigger picture.
- Drop-off and repeat contact — how many customers abandon a stage or contact you twice about the same thing.
Qmeter supports this by tagging every response with branch, service and channel, so scores can be compared stage by stage in the report builder. See omnichannel feedback collection for matching channels to touchpoints.
Common journey mapping mistakes
- Mapping from assumptions. Without data, the map reflects internal opinion.
- Mapping everything at once. A map of every journey for every segment is too broad to act on.
- Forgetting physical touchpoints. Branches, counters, waiting areas and exits are where many experiences are decided — and where email surveys never reach.
- No owner per stage. A pain point without an owner is just a sticky note.
- Drawing it once. Journeys change with every new policy, product or channel.
Frequently asked questions
What is the difference between a customer journey and a journey map?
The customer journey is the real sequence of interactions a customer has with a business. The journey map is the diagram that documents it, showing stages, touchpoints, actions, emotions, owners and how each step is measured.
What are the stages of a customer journey?
A common simple model is awareness, consideration, purchase, service and loyalty or renewal. Real maps use the stages that fit the business, such as booking, arrival, waiting, service and follow-up for a clinic.
How do you validate a customer journey map?
Collect feedback at the touchpoints on the map — a short survey at each moment of truth — and compare the results with the pain points the map predicts. Where the data disagrees with the map, redraw the map.
How often should a journey map be updated?
Review it against live feedback at least quarterly and redraw it whenever a significant change happens, such as a new channel, policy, product or location format.
Measure it at every location — live in one day
Feedback kiosks, QR and web surveys, SMS and email, real-time alerts and follow-up tickets in one platform. 14-day free trial.
✓ 15 minutes · ✓ No commitment · ✓ A real CX person